Applied NAPL Science Review
Demystifying NAPL Science for the Remediation Manager
Editor: J. Michael Hawthorne, PG
Asst. Editor: Dr. Rangaramanujam Muthu
ANSR Scientific Review Board
J. Michael Hawthorne, PG, Board of Chairman, GEI Consultants Inc.
Mark Adamski, PG, BP Americas
Stephen S. Boynton, PE, LSP, Subsurface Env. Solutions, LLC
Dr. Randall Charbeneau, University of Texas
Paul Cho, PG, CA Regional Water Quality Control Board-LA
Robert Frank, RG, CH2M Hill
Dr. Sanjay Garg, Shell Global Solutions (US) Inc.
Randy St. Germain, Dakota Technologies, Inc.
Dr. Dennis Helsel, Practical Stats
Dr. Terrence Johnson, USEPA
Andrew J. Kirkman, PE, BP Americas
Mark Lyverse, PG, Chevron Energy Technology Company
Mark W. Malander, ExxonMobil Environmental Services
Applied NAPL Science Review (ANSR) is a scientific ejournal that provides insight into the science behind the characterization and remediation of Non-Aqueous Phase Liquids (NAPLs) using plain English. We welcome feedback, suggestions for future topics, questions, and recommended links to NAPL resources. All submittals should be sent to the editor.
Site Wide Analysis of LNAPL Distribution
and Hydrogeologic Conditions
Using Plume Scale Diagnostic Gauge Plots
GEI Consultants, Inc.
Apparent NAPL Thickness (ANT) and Calculated Groundwater Surface (CGWS) based Diagnostic Gauge Plots (DGP) for individual wells (well scale DGP analysis) are powerful tools for light non-aqueous phase liquid (LNAPL) analysis and LNAPL conceptual site modeling (LCSM) that can be used to:
- Identify the NAPL hydrogeologic condition for a well (unconfined, confined, perched);
- Estimate the mobile NAPL interval (mobile NAPL thickness) in the formation;
- Estimate confining or perching elevations; and
- Calculate effective LNAPL density.
While these tools were originally created to evaluate individual wells, they may also be utilized to obtain a general understanding of an entire site’s NAPL distribution and hydrogeologic conditions. At this plume scale, DGP analysis can yield:
- Identification of separate transmissive zones with NAPL;
- Identification of NAPL hydrogeologic condition(s) for each transmissive zone; and
- Estimation of the range of NAPL thicknesses associated with each transmissive zone.
Figure 1 provides a map of the distribution of wells at a Gulf Coast refinery with both unconfined and confined NAPL occurring in sand lenses Interbedded with silts and clays at various depths. This site exhibits exaggerated (large) apparent NAPL thickness (ANT) values as a result of the confining conditions. The map was created from the analysis of individual well scale DGP plots, and was a crucial tool to correct the regulatory management path for the site, which had previously focused incorrectly on ANT rather than NAPL recoverability to direct NAPL remedy efforts.
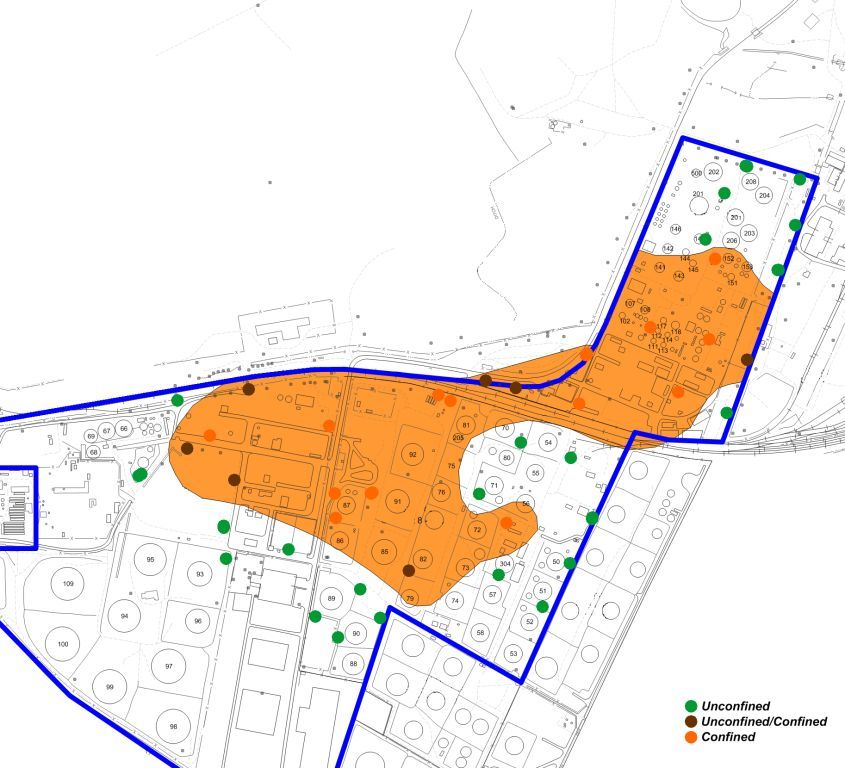
Figure 1. Confined Zone Map developed from well scale DGP analysis of historically available gauging data. Brown wells exhibit fluctuating unconfined or confined conditions over time while orange wells exhibit constant confined NAPL conditions. Green wells exhibit constant unconfined NAPL conditions.
While this map is an important and powerful LCSM tool to ensure understanding of the context for NAPL management, it does not provide a clear picture or context for the vertical distribution of NAPL. Nor does it identify whether the LNAPL at each of these locations exists in one or multiple transmissive zones, and how the distribution of hydrogeologic condition might be related to the vertical distribution of NAPL and its occurrence in given stratigraphic horizons.
The vertical distribution of LNAPL is important in understanding plume stability, risks to receptors, and selection of an appropriate corrective action. To address the vertical distribution gap, diagnostic gauge plots (ANT and CGWS) for all historic data for all wells with NAPL for the entire site were constructed (Figures 2 and 3). These plume scale DGP graphs clearly demonstrate the overall context of NAPL hydrogeologic conditions for the site.
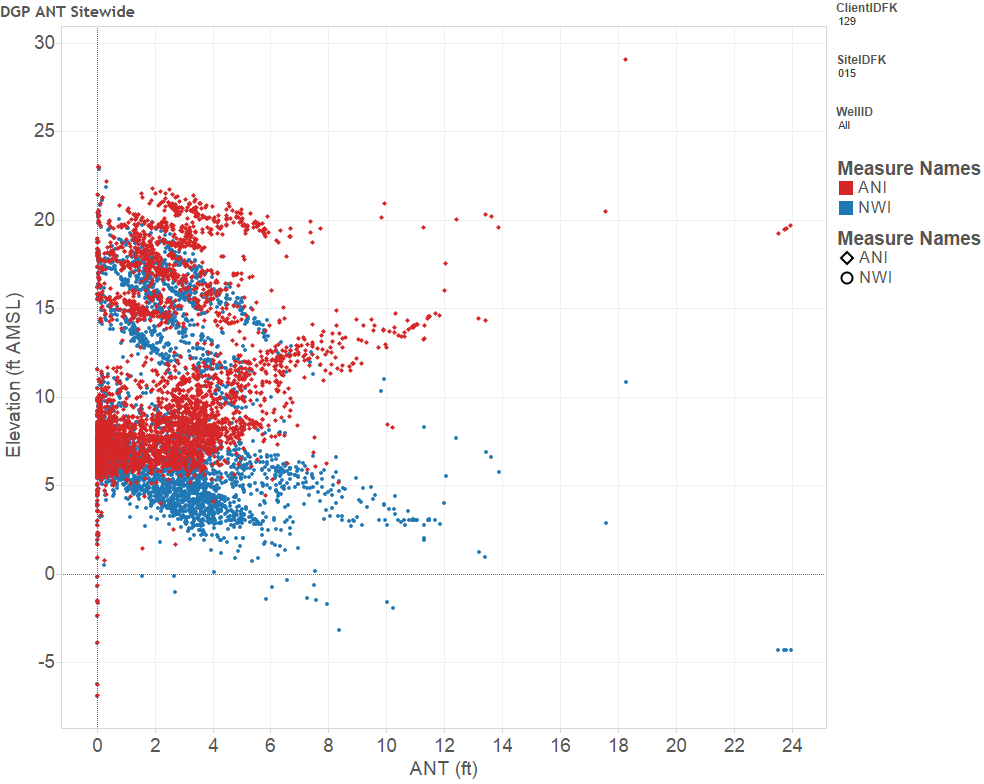
Figure 2. Site Wide Apparent NAPL Thickness (ANT) DGP. Red dots are gauged air/NAPL interface elevations while blue dots are corresponding gauged NAPL/water interface elevations. The vertical axis is elevation in feet above mean seal level while the horizontal axis is apparent NAPL thickness gauged in wells in feet. Note the presence of distinct shallow versus deep zones of NAPL occurrence.
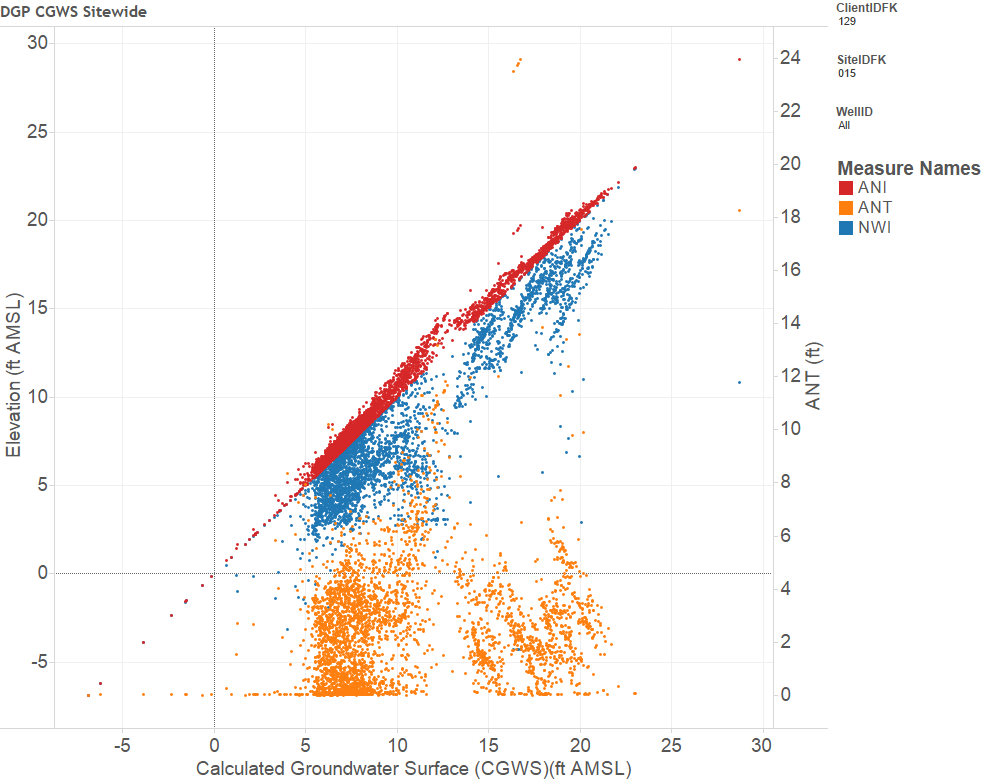
Figure 3. Site Wide Calculated Groundwater Surface (CGWS) DGP. Red dots are gauged air/NAPL interface elevations while blue dots are corresponding gauged NAPL/water interface elevations. Orange dots are apparent NAPL thickness gauged in wells. Note the presence of two distinct zones of NAPL occurrence at shallow versus deep CGWS elevations.
The site wide scale DGP graphs reveal that the site exhibits two vertically separated transmissive zones with mobile NAPL – one shallow at groundwater elevations ranging from 14-22 feet above mean sea level (AMSL) and one deeper at groundwater elevations ranging from 5-12 feet AMSL.
A close look at each of these two transmissive zones reveals a correlation between transmissive zone and hydrogeologic condition. All shallow wells exhibit unconfined NAPL as evidenced by the diagnostic “falling wedge” shape in this zone. The deep wells exhibit a combination of unconfined and confined NAPL as evidenced by the side-by-side “falling wedge” at smaller ANT values and “rising wedge” for larger ANT values (Figure 4).
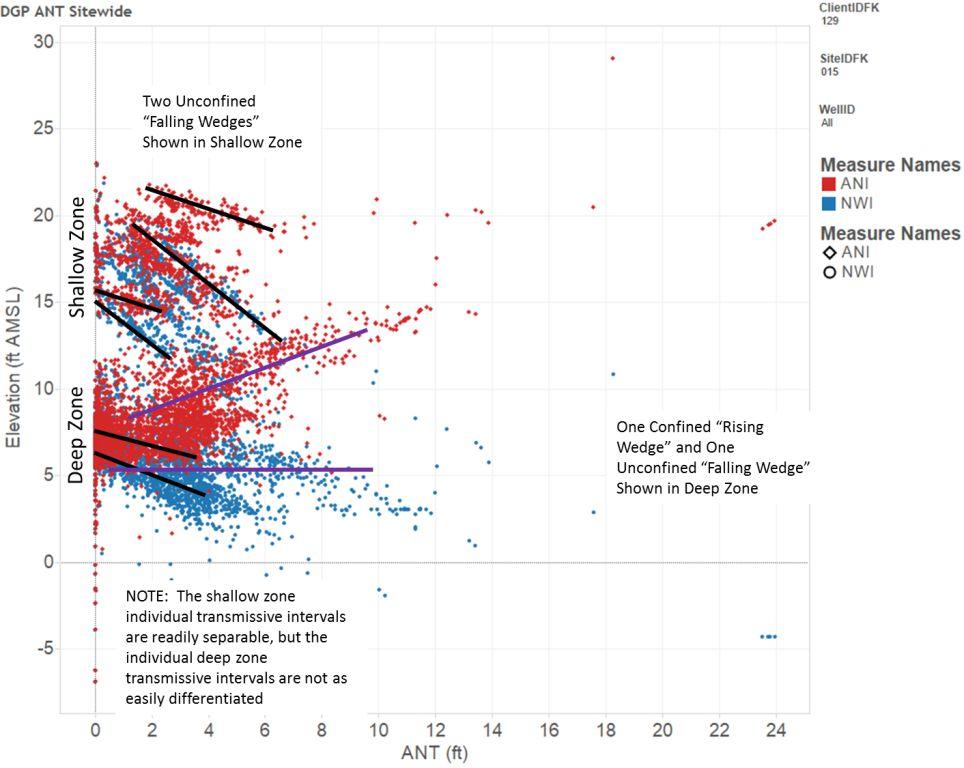
Figure 4. Annotated site wide ANT DGP showing selected “falling wedges” of unconfined NAPL in the shallow zone and both “rising wedges” of confined NAPL and one “falling wedge” of unconfined NAPL in the deep zone. Red dots are gauged air/NAPL interface elevations while blue dots are corresponding gauged NAPL/water interface elevations. Black lines mark the top and bottom of each “wedge”. The shallow zone contains at least five such “wedges”, but only two are marked to avoid overlapping.
In addition to these broad generalizations, a detailed analysis of each zone reveals smaller scale trends:
Shallow Zone
- At least five sub-intervals of unconfined NAPL can be observed
- One possible perched interval may be present
- Virtually all observed ANT values are small, generally less than 4-6 feet of gauged thickness.
Deep Zone
- The deeper zone exhibits greater complexity, but less divisibility
- Unconfined NAPL occurs at smaller ANT values (the “falling wedge”) while confined NAPL occurs from smaller to larger ANT values (“rising wedge”)
- The NAPL/Water interface for the confined “rising wedge” is not consistently stable suggesting that at least some of the confining layers may be leaky
The unconfined and confined conditions in the lower transmissive zone occur at the same elevation, suggesting that some areas possess confining units at those elevations, while other areas do not, leading to an interpretation of strong lateral lithologic heterogeneities. The highest ANT values occur only in the deeper transmissive zone, and are associated with the confined NAPL.
Summary: Evaluation of all site equilibrium or near-equilibrium gauging data at both the well scale and the site wide scale provides critical contextual information to understand the distribution and hydrogeologic condition of NAPL across a site, thereby substantially improving the LCSM. This improved LCSM will yield significantly more reliable risk evaluations and model results, particularly for the estimation of LNAPL volumes in place as well as the estimation of total recoverable NAPL and production sustainability curves. As a result, risk-based remediation decisions will improve, remedy design will more accurately reflect site conditions, and remedy success will be improved.
A Word of Caution: For DGP plots to be meaningful the gauging data used to create them must represent equilibrium or near-equilibrium conditions. Individual points forming the DGP plots may need to be scaled significantly smaller than normal so that overall patterns may be observed at the site wide DGP scale. Some sites may not reveal interpretations as clear at the plume scale as those shown in this article, but that of course is an important contextual understanding on its own for a site. Interpretations at the plume scale will be improved by evaluating well-scale DGPs. As always, DGP plots should not be blindly relied upon, but should be interpreted by qualified professionals within the overall context for a site.
Related Links
API LNAPL Resources
ASTM LCSM Guide
Env Canada Oil Properties DB
EPA NAPL Guidance
ITRC LNAPL Resources
ITRC LNAPL Training
ITRC DNAPL Documents
RTDF NAPL Training
RTDF NAPL Publications
USGS LNAPL Facts
ANSR Archives
Coming Up
Look for more articles on LNAPL transmissivity as well as additional explanations of laser induced fluorescence, natural source zone depletion and LNAPL Distribution and Recovery Modeling in coming newsletters.
Announcements
An updated version of the ASTM Guide for Calculating LNAPL Transmissivity is Now Available for Purchase at www.astm.org.
ASTM Standard E2856 – Standard guide for Estimation of LNAPL Transmissivity is now available
The ASTM LNAPL Conceptual Site Model (LCSM) workgroup is actively updating the ASTM LCSM guidance document. If you are interested in participating on this team or would like to send comments for consideration – please contact Andrew Kirkman of BP Americas (team leader).
ANSR now has a companion group on LinkedIn that is open to all and is intended to provide a forum for the exchange of questions and information about NAPL science. You are all invited to join by clicking here OR search for “ANSR – Applied NAPL Science Review” on LinkedIn. If you have a question or want to share information on applied NAPL science, then the ANSR LinkedIn group is an excellent forum to reach out to others internationally.