Applied NAPL Science Review (ANSR)
Demystifying NAPL Science for the Remediation Manager
Review Board:
J. Michael Hawthorne, PG, Board of Chairman, GEI Consultants, Inc.
Mark Adamski, PG, BP America
Dr. Randall Charbeneau, University of Texas
Dr. Sanjay Garg, Shell Global Solutions (US) Inc.
Dr. Terrence Johnson, United States Environmental Protection Agency
Andrew Kirkman, PE, AECOM
Mark Malander, ExxonMobil Environmental Services
Perched LNAPL
Mark Adamski – BP America
Sanjay Garg, PhD – Shell Global Solutions (US) Inc.
Andrew Kirkman, PE – AECOM
Have you ever wondered why the apparent NAPL thickness (ANT) gauged in wells at a site is large, but increased groundwater extraction does not increase LNAPL recovery rate? The cause may be perched LNAPL.
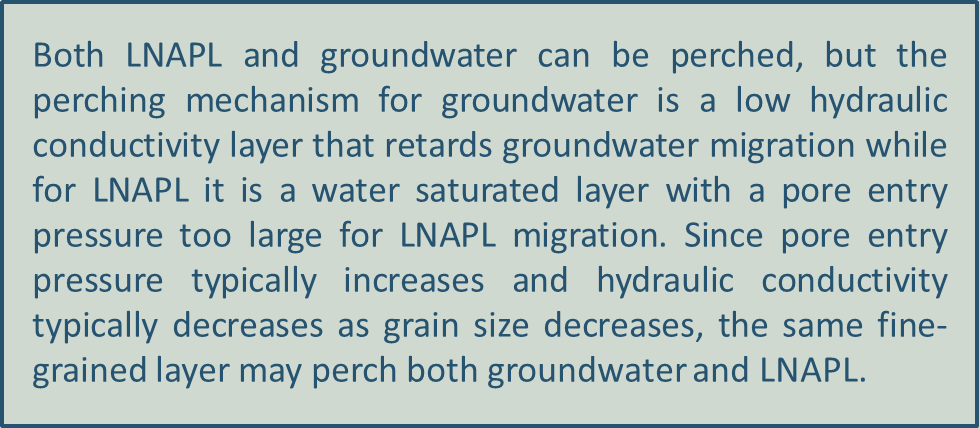
BACKGROUND: Much like groundwater, LNAPL can be perched on finer-grained soils in the vadose zone, although the underlying processes that cause LNAPL and groundwater to perch are different. Apparent NAPL thickness (ANT) and recovery from wells that are cross-screened across perching layers down to the water table can exhibit behavior that is contrary to expectations. Perched LNAPL may create exaggerated ANTs that are not representative of LNAPL mobility or recoverability in wells and could lead to misdirected remediation efforts.
In previous issues we have discussed various explanations for exaggerated ANT gauged in wells, including Confined and Perched LNAPL. In this issue we will define what we mean by Perched LNAPL, identify conditions under which it may occur and outline some diagnostic approaches for identifying perched LNAPL.
Definition: Perched light non-aqueous phase liquid (LNAPL) is mobile LNAPL that accumulates in the vadose zone of a site for some time period above a layer that exhibits a pore entry pressure greater than the LNAPL head pressure, thereby impeding the downward migration of LNAPL.
INTERPRETATION: As described in the ANSR issue on Confined LNAPL, groundwater is typically considered to be the “wetting” fluid when both groundwater and LNAPL are present because water preferentially adheres to sediment surfaces and fills small pores. LNAPL (the “non-wetting” fluid) typically occurs in the center of large pores isolated from pore walls by water. A measure of the resistance to non-wetting phase (LNAPL) displacement of wetting phase (water) from pore space is called the entry pressure, which can be significant at locations exhibiting large variations in pore size.
As grain size and associated pore sizes decrease, finer soils have a lower hydraulic conductivity and tend to retain more moisture. Due to this retained moisture the finer-grained soils possess pore entry pressure inhibiting LNAPL downward migration. In contrast to this pore entry pressure barrier, it is the lower conductivity of the soil that retards the downward migration of water (wetting fluid not subject to pore entry pressure).
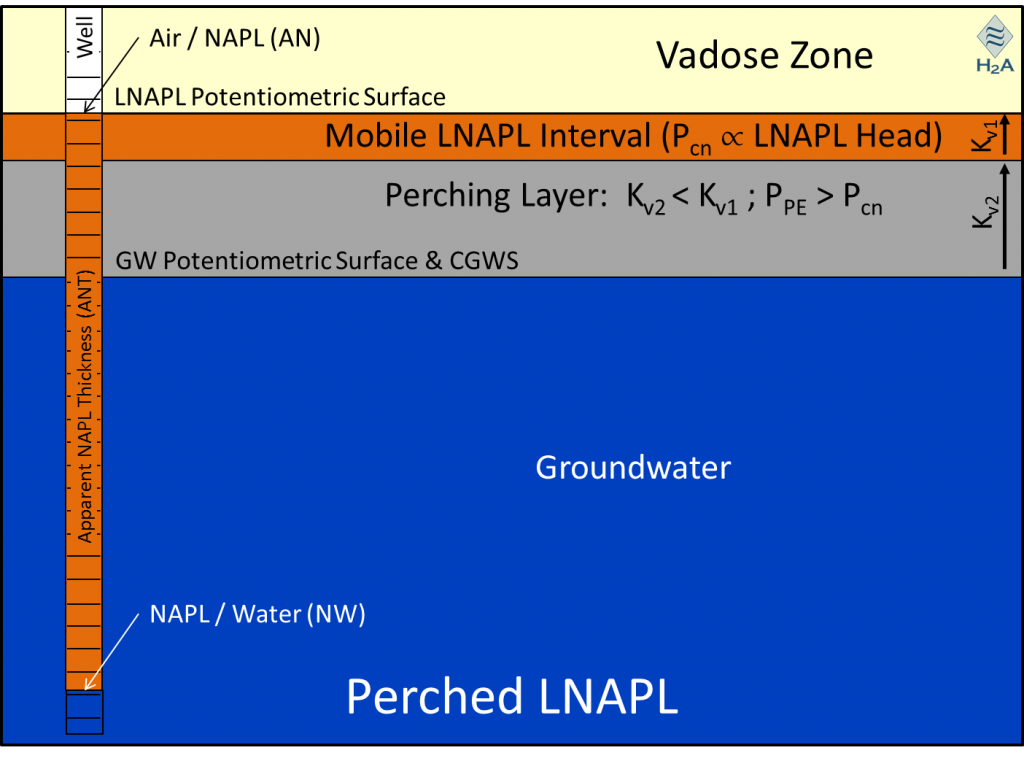
Cross-sectional view of perched LNAPL. AN and NW are Air/NAPL and NAPL/Water interfaces, respectively; PPE is pore entry pressure, Pcn is NAPL capillary pressure, and the symbol following Pcn means “is proportional to”; Kv1 and Kv2 are vertical hydraulic conductivities of the layer containing mobile LNAPL and the perching layer, respectively; GW is groundwater and CGWS is calculated groundwater surface.
Typically an LNAPL perching layer can be identified by the expected changes in soil properties such as grain size and permeability that lead to high pore entry pressures. In such cases, LNAPL in cross-screened monitoring wells will exhibit a perched response on a Hydrostratigraph. Adequate site characterization (e.g., continuous cores, CPT/LIF) and well completion intervals are critical to the recognition of perched LNAPL. If a well is screened only across a perched LNAPL zone (with or without the presence of perched groundwater) and terminates at or above the top of the perching layer below, a Diagnostic Gauge Plot or Discharge versus Drawdown Graph will typically indicate unconfined conditions. If a well is screened across and below the perched mobile LNAPL interval, a Diagnostic Gauge Plot or Discharge versus Drawdown Graph may indicate perched LNAPL.
SUMMARY: Mobile LNAPL is perched when pore entry pressure in the vadose zone layer underlying the LNAPL is greater than the LNAPL capillary pressure. If a well is screened across the mobile LNAPL interval above the perching layer and is also completed below the top of the perching layer, then the well may act as a sump for LNAPL to accumulate until it equalizes with the top of the mobile LNAPL interval above the perching layer. This sump effect results in an exaggerated apparent NAPL thickness (ANT) in the well that is not representative of LNAPL mobility or recoverability. In addition, the well may act as a conduit for perched LNAPL to migrate to deeper groundwater.
The maximum drawdown that perched LNAPL can “see” is the thickness of mobile LNAPL above the perching layer. Consequently, no matter how much groundwater drawdown is applied to an aquifer below the perched LNAPL, LNAPL production will not increase. Applied vacuum may be more effective in perched conditions for increasing drawdown to LNAPL.
REAL WORLD LIMITATIONS: A word of caution – Perched LNAPL may be ephemeral in fluctuating groundwater conditions. Vertical gradients or macropores with low pore entry pressures (e.g., faults, fractures, root holes) often naturally present in fine-grained soils may result in vertical migration of LNAPL through otherwise perching layers. The conditions described represent selected points within a large range of complex realizations of combinations of liquid pressures, multiphase fluid mechanics, and hydrodynamic groundwater conditions. Diagnostic Gauge Plots, Hydrostratigraphs, and Discharge versus Drawdown Graphs may help to distinguish these various conceptual site model conditions. As always, multiple lines of evidence should be used.