Applied NAPL Science Review
Demystifying NAPL Science for the Remediation Manager
Editor: J. Michael Hawthorne, PG
Asst. Editor: Dr. Rangaramanujam Muthu, PE
ANSR Scientific Advisory Board
J. Michael Hawthorne, PG, Board Chairman, GEI Consultants, Inc
Mark Adamski, PG, Statoil
Stephen S. Boynton, PE, LSP, Subsurface Env. Solutions, LLC
Dr. Randall Charbeneau, PE, University of Texas
Paul Cho, PG, CA Regional Water Quality Control Board-LA
Robert Frank, RG, CH2M
Dr. Sanjay Garg, Shell Global Solutions (US) Inc.
Randy St. Germain, Dakota Technologies, Inc.
Dr. Dennis Helsel, Practical Stats
Dr. Terrence Johnson, USEPA
Andrew J. Kirkman, PE, BP Americas
Mark Lyverse, PG, Chevron Energy Technology Company
Mark W. Malander, ExxonMobil Environmental Services
Applied NAPL Science Review (ANSR) is a scientific ejournal that provides insight into the science behind the characterization and remediation of Non-Aqueous Phase Liquids (NAPLs) using plain English. We welcome feedback, suggestions for future topics, questions, and recommended links to NAPL resources. All submittals should be sent to the editor.
DISCLAIMER: This article was prepared by the author(s) in their personal capacity. The opinions expressed in this article are the author’s own and do not necessarily reflect the views of Applied NAPL Science Review (ANSR) or of the ANSR Review Board members.
Natural Source Zone
Depletion Rate Assessment
CH2M
Introduction
The emerging science of natural source zone depletion (NSZD) is coming to the forefront of decision-making at petroleum hydrocarbon remediation sites because of the significant values reported in the literature (1,2). NSZD is the term used to collectively describe natural losses of light non-aqueous phase liquid (LNAPL) that occur through volatilization, dissolution, and biodegradation within the subsurface (3). At sites where ample atmospheric oxygen exchange with the subsurface occurs, LNAPL biodegradation results in efflux of carbon dioxide (CO2) at the ground surface. ANSR v5i2 further describes the concept of NSZD and measuring LNAPL degradation rates using the CO2 efflux methods discussed herein (4).
This article reports measured NSZD rates from multiple diverse sites that were estimated using CO2 efflux methods in order to help practitioners better understand the relative magnitude of measured NSZD rates. NSZD rates are typically reported in a new unit of measure, gallons per acre per year (gal/ac/yr). This article provides some context to the NSZD rates by comparing them to mass removal rates from other remediation approaches converted to this same unit of measure.
It is very important to note that while a rate comparison is made, the intent of this article is not to imply that any one remedial approach is better or more appropriate than another. This is only intended to provide context and show that measured NSZD rates are reasonable and within the mass removal realm achieved by other remedial technologies.
Measured NSZD Rates
NSZD data are reported for 11 diverse sites collected between 2011 and 2015. Table 1 summarizes the site conditions and types and numbers of measurements. The sites include urban and rural areas with predominantly pervious, but variable ground cover over consolidated and unconsolidated subsurface soil types. The sites had various sizes, sources, types, and ages of petroleum releases.
NSZD rates were measured using the dynamic closed chamber (DCC; LI-COR Biosciences, Inc., Lincoln, NE) and CO2 Trap (E-Flux, LLC, Fort Collins, CO) methods. A total of 18 DCC monitoring events were performed using a LI-COR 8100A in survey-mode (i.e., single measurements). Each one to two day monitoring event generally consisted of collecting total CO2 efflux readings from a network of 15 to 35 survey locations per site. Background correction of each DCC data set was made by subtracting CO2 efflux from outside the LNAPL footprint after being parsed into areas of common ground cover. A total of 12 E-Flux Trap monitoring events were performed and generally consisted of collecting measurements from five to ten locations at each site. Traps were deployed for a two to three week period and radiocarbon dating analysis for 14C was used to correct for background.
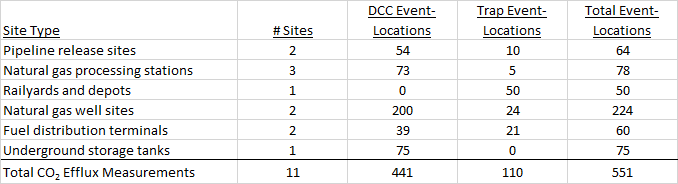
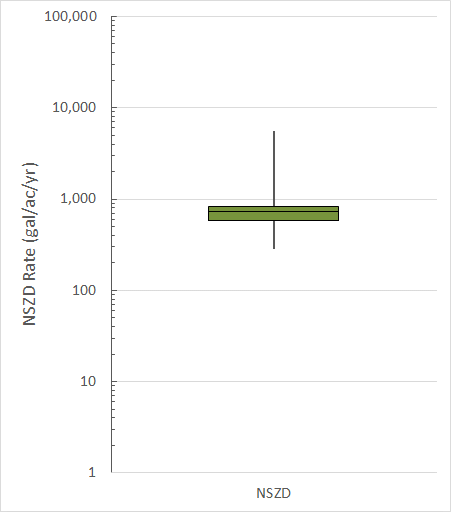
Figure 1 presents a box plot of the estimated sitewide, geospatially averaged, NSZD rates. Rates were generally observed within an order-of-magnitude ranging between 300 to 5,600 gal/ac/yr. The lowest rate was measured at a site in Alberta with natural gas liquid LNAPL in sedimentary bedrock. The highest rate was measured at a semi-arid site in Colorado with weathered diesel in a sand and gravel formation. The median, sitewide-averaged NSZD rate for the 11 sites in the data set was estimated at 700 gal/ac/yr.
NSZD Rates within a Remedial Context
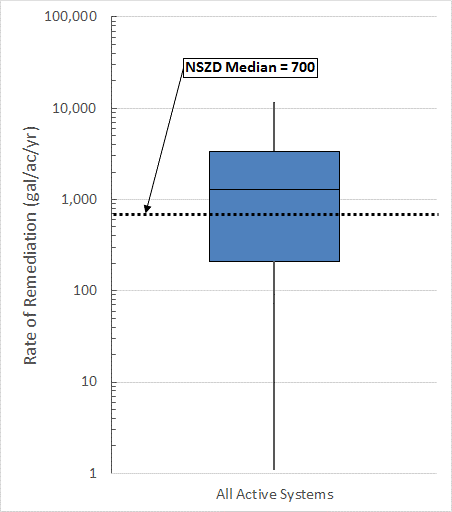
To help practitioners better understand the relative magnitude of the NSZD measurements, mass removal rates from systems on which CH2M performs operation, maintenance, and monitoring were reviewed. It included active remediation mass removal rate data from 29 different systems ranging from LNAPL skimming to multiphase extraction. Rates of mass removal were normalized per unit acre by simply dividing the total mass removed by the design target treatment area. The data set included various system ages, petroleum products, target treatment zone dimensions, operational objectives, and optimized operation approaches (e.g., zones, pulsing).
Figure 2 presents a box plot of the range in studied active remediation rates in the units of gal/ac/yr. The chart shows a wide range of active remediation rates, but the median measured NSZD rate generally falls within the middle two quartiles.
Conclusions
This article demonstrates that the NSZD rates measured using CO2 efflux methods are significant and reasonable as compared to reported mass removal rates from the active remediation systems studied herein. This helps to qualitatively validate the results of the CO2 efflux methods and affirms the importance of collecting the data. Understanding site-specific rates of NSZD is not only useful to refine the conceptual site model, but also to help support remedy decision-making. The value of the NSZD measurements grows when it is included with trend charts that show decreasing LNAPL transmissivity and groundwater contaminant concentrations, for example. When paired, these data sets collaboratively affirm the effectiveness of NSZD and will ultimately help facilitate more widespread use of NSZD data for remedial decision making and remedy evaluation purposes.
References:
1. Lundegard P.D. and Johnson, P.C. 2006. Source Zone Natural Attenuation at Petroleum Hydrocarbon Spill Sites—II: Application to a Former Oil Field. Groundwater Monitoring & Remediation. 26, issue 4: 93-106.
2. McCoy, K., J. Zimbron, T. Sale, and M. Lyverse (McCoy et. al.). 2015. Measurement of Natural Losses of LNAPL Using CO2 Traps. Groundwater. Volume 53, Issue 4, July/August. Pages 658-667.
3. Interstate Technology Regulatory Council (ITRC). 2009. Technology Overview: Evaluating Natural Source Zone Depletion at Sites with LNAPL. April.
4. de Courcy-Bower, D., J. Zimbron, and C.D. Stone. 2015. Measuring LNAPL Degradation Rates using CO2 Flux Methods. Applied NAPL Science Review (ANSR). Volume 5, Issue 2, July.
Research Corner

Thank you to Dr. Tom Sale of the Colorado State University, Center for Contaminant Hydrology, for providing access to selected graduate level NAPL research.
Evaluation of Three Methods for Estimating Formation Transmissivity to LNAPL
Gabriel Charles Iltis
Master of Science
Colorado State University
Abstract: Light non-aqueous phase liquids (LNAPLs) are persistent sources of groundwater contamination commonly encountered beneath petroleum refining, transmission, and storage facilities. The primary concerns associated with LNAPL contamination include the potential for LNAPL migration as a separate liquid phase and groundwater contamination resulting from dissolution of LNAPL constituents into the aqueous phase. The potential for LNAPL migration is dependent on the soil formation transmissivity to LNAPL. This thesis compares the relative merits of three methods of estimating formation transmissivity to LNAPL, including baildown tests, petrophysical methods, and single-well tracer dilution techniques. Over the last twenty years, a number of techniques have been developed to characterize formation transmissivity to LNAPL. Two
of the most commonly utilized methods are baildown tests and petrophysical methods. In addition, Colorado State University (CSU) has developed a down-well probe that enables the implementation of single-well tracer dilution techniques within LNAPL present in a well screen. This technology provides a discrete measurement of the in-situ flow rate of LNAPL through the well screen. Given the local LNAPL gradient, measured in situ flow rates can be transformed to formation LNAPL transmissivity values. The results of laboratory testing conducted in a two-dimensional sand tank suggest that estimates of LNAPL transmissivity obtained from both baildown and tracer dilution techniques compare reasonably well to known values based on Darcy’s equation (92.2 and 88.2% of the Darcy’s equation value respectively). Laboratory scale versus petrophysical analysis tended to underestimate LNAPL transmissivity resulting in values that are 22.2 to 47.7% of the Darcy’s equation values. Petrophysical analysis was conducted using both the Brooks-Corey and van Genuchten capillary pressure-saturation models, and two saturated hydraulic conductivity values. The primary limitation of the laboratory scale petrophysical analysis is the accuracy of the permeability values determined using disturbed soil samples and laboratory permeameters. Test methods for evaluating formation transmissivity to LNAPL were also compared at a single field location (well SS-146) in Evansville, Wyoming. Field baildown tests were evaluated using two methods: the modified Bouwer-Rice method, and the Cooper-Jacob method. Bouwer-Rice analysis of a single data set estimated LNAPL transmissivity to be 3 cm2/min. Two sets of test data, analyzed using the Cooper-Jacob method yielded transmissivity values of 0.3 cm2/min and 1.8 cm2/min. Tracer dilution testing evaluated the LNAPL transmissivity to be 0.06 cm2/min. Petrophysical analysis yielded transmissivity values varying by six orders of magnitude (3.6E-5 to 5.2 cm2/min). The large variation reflects differences in hydraulic conductivity values obtained from an aquifer test (high end) and laboratory permeameters studies (low end). For the field study, there is no reference value for LNAPL transmissivity with which to evaluate accuracy of each method. The primary issue associated with baildown testing is the subjectivity of data analysis and potential changes in fluid saturations local to the well associated with the testing procedure. The limitation of the tracer dilution technique is the dependence of the method on accurate resolution of the LNAPL gradient through the well. The potential v inaccuracies in analysis of field properties using ex situ laboratory tests is the primary limitation of petrophysical analysis. Given the conditions evaluated in this thesis, the baildown test methods provide the most reasonable estimates of formation transmissivity to LNAPL. In comparison, the tracer dilution technique is constrained (in field applications) by the accuracy to which the local LNAPL gradient can be evaluated. However, the tracer dilution techniques do not have this limitation if one is interested in determining, directly, the rate of LNAPL flow. Lastly, petrophysical methods are constrained by the accuracy to which estimates of in situ soil parameters can be determined using disturbed soil specimens and ex situ laboratory test methods.
The primary objective of ANSR is the dissemination of technical information on the science behind the characterization and remediation of Light and Dense Non-Aqueous Phase Liquids (NAPLs). Expanding on this goal, the Research Corner has been established to provide research information on advances in NAPL science from academia and similar research institutions. Each issue will provide a brief synopsis of a research topic and link to the thesis/dissertation/report, wherever available.
Practical Stats
Top Twelve Tip #8:
Meet the demands of regression: LNC
Dr. Dennis Helsel
www.practicalstats.com
Linear regression makes three assumptions when fitting a straight-line model to data — LNC. First, the y versus x relationship should be linear (L). There is little reason to fit a straight-line model to data that are curved. Predictions from the line would not be near where data are located. Second, the residuals should follow a normal distribution (N). This assures that the p-values are correct for this parametric process. If residuals are skewed, p-values will be too high, and significant x variables could be tossed away by mistake. Note that the normality assumption is not about the y variable, nor the x variable, but for their joint pattern as shown by residuals. Third, the variability around the line should be constant (C) for all values of x. Violation of this will again lead to a loss of power, possibly not seeing variables to be significant that actually are.
Environmental data commonly violate all three assumptions in their untransformed state. Relationships appear curved, residuals skewed, and variation around the line increasing as the x variable increases. Evaluation of the three assumptions can be done using plots:
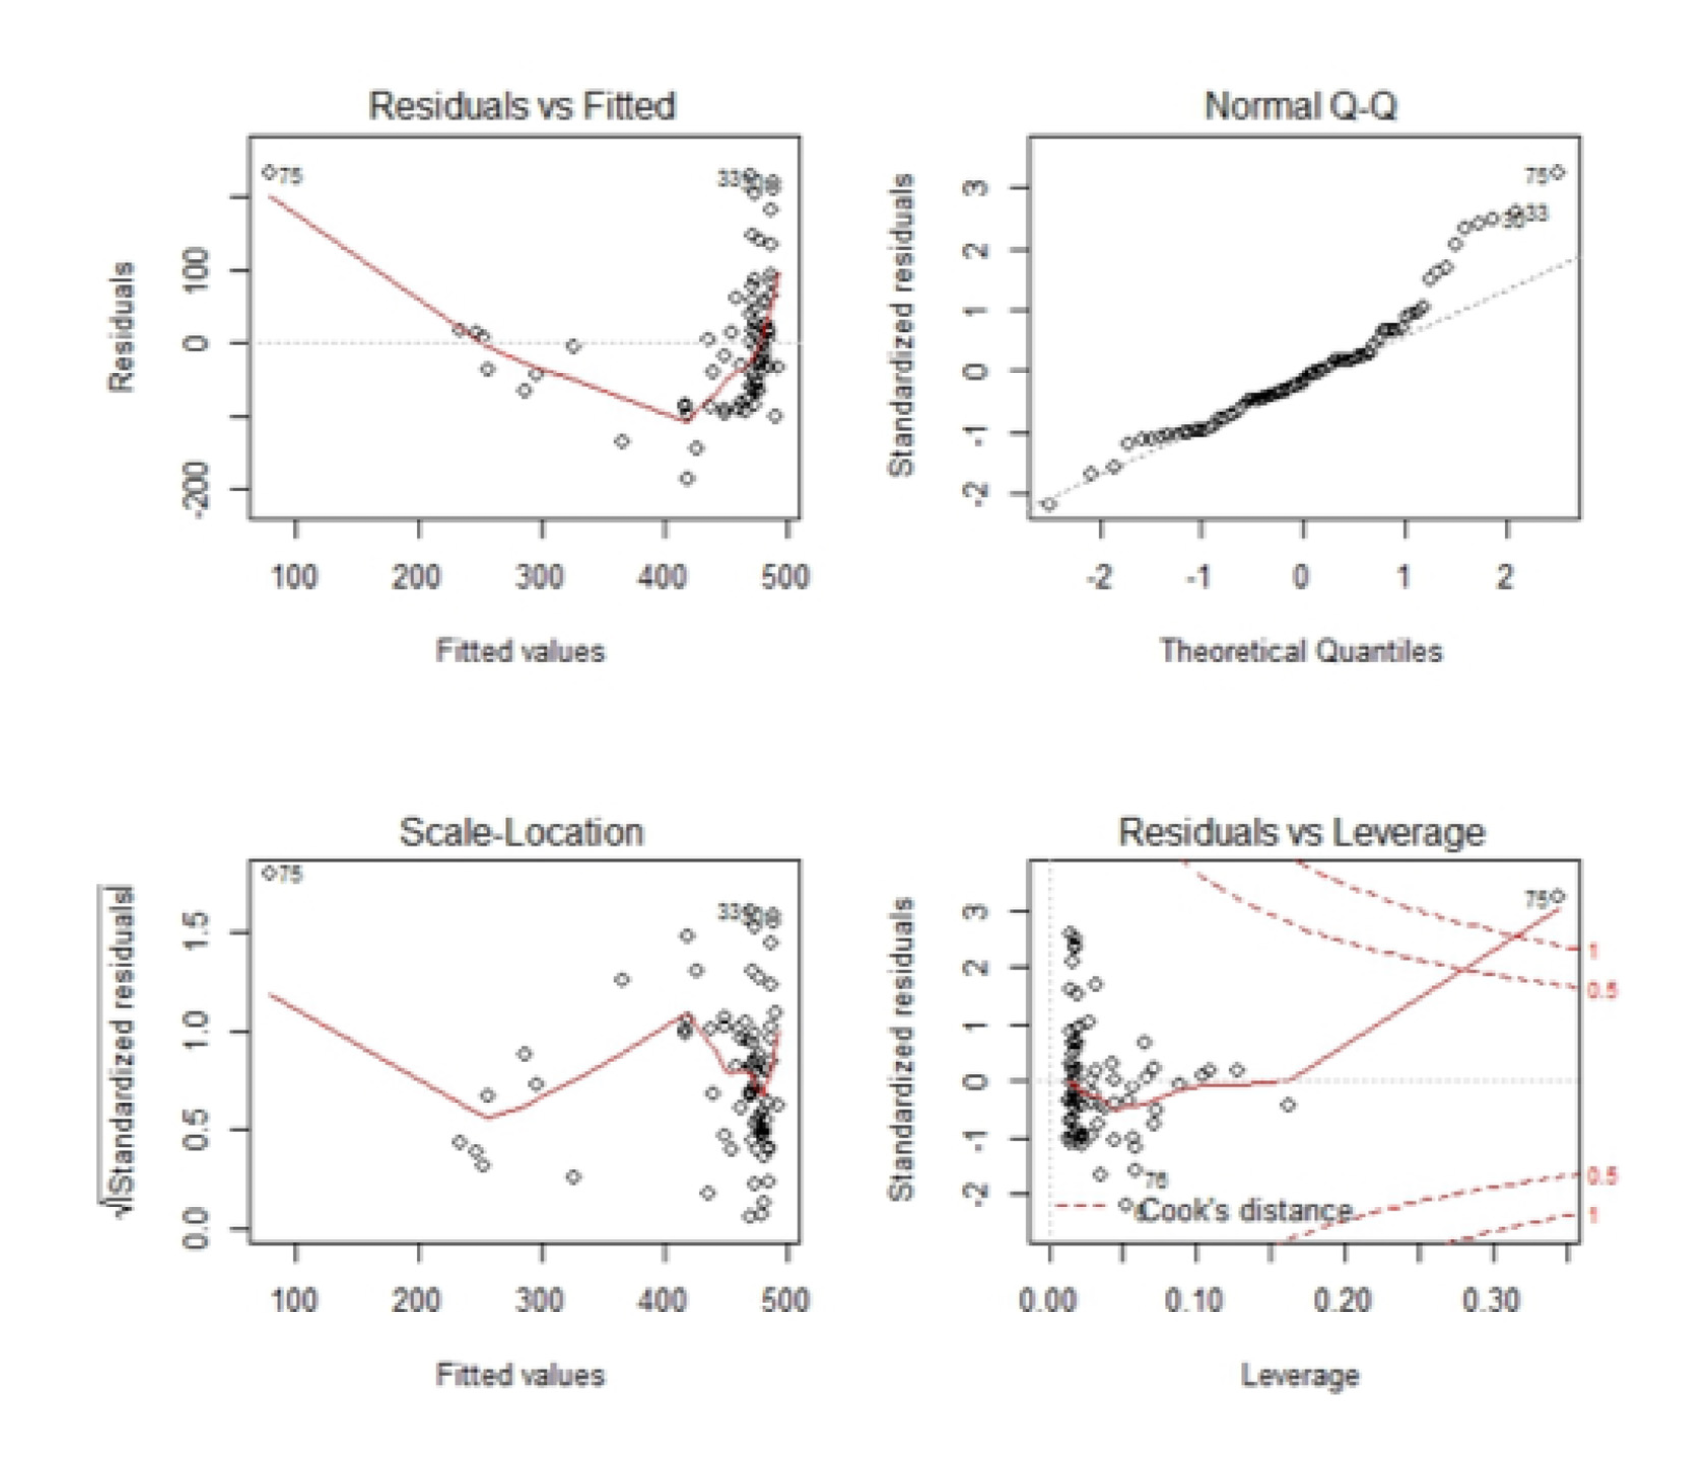
Upper left: a “residuals plot” to check if the pattern is linear.
Upper right: a probability plot to check the normality of residuals.
Lower left: a plot of standard error versus fitted values, to check whether variance is changing.
Alternatively, residuals can be checked for normality using the Shapiro-Wilk test and for constant / changing variances using the Breusch-Pagan or similar test. For decades, noncompliance with assumptions was dealt with by transforming the y variable, often using logarithms. Logs frequently produce a straight-line pattern, near-normal residuals and constant variance. But the predicted values in original units are then geometric means (medians), not estimated means (see Tip #5). Today bootstrapping the regression relationship provides an alternative to transformation of the y-variable, avoiding normality and constant variance assumptions. However, the linear pattern remains important. If the data aren’t linear, don’t fit a linear model even with bootstrapping. Transformations to linearity still may be necessary.
Related Links
API LNAPL Resources
ASTM LCSM Guide
Env Canada Oil Properties DB
EPA NAPL Guidance
ITRC LNAPL Resources
ITRC LNAPL Training
ITRC DNAPL Documents
RTDF NAPL Training
RTDF NAPL Publications
USGS LNAPL Facts
ANSR Archives
Coming Up
Look for more articles on LNAPL transmissivity as well as additional explanations of laser induced fluorescence, natural source zone depletion and LNAPL Distribution and Recovery Modeling in coming newsletters.
Announcements
ITRC 2-DAY CLASSROOM TRAINING:
Light Non-aqueous Phase Liquids (LNAPL): Science,
Management, and Technology
May 9-10, 2016 in Denver, CO
September 26-27 in Somerset, NJ
November 9-10, 2016 in Boston (area), MA
This 2-day ITRC classroom training is based on the ITRC Technical and Regulatory Guidance Web-Based Document, Petroleum Vapor Intrusion: Fundamentals of Screening, Investigation, and Management (PVI-1, 2014) and led by internationally recognized experts. The class should enable the trainee to:
- Develop on-the-job skills to screen-out petroleum sites based on the scientifically-supported ITRC strategy and checklist.
- Focus the limited resources investigating those PVI sites that truly represent an unacceptable risk; communicate ITRC PVI strategy and justify science-based decisions to management, clients, and the public.
- Understand the essential principles of biodegradation and the fundamentals of vapor movement through the vadose zone.
- Appreciate the important role of modeling in the investigation of petroleum sites.
Additional information on the Denver training is available at https://www.regonline.com/builder/site/Default.aspx?EventID=1788784
Information on 2016 dates and locations coming soon. To receive an email when more information is available, email us at training@itrcweb.org.
Tenth International Conference on Remediation of Chlorinated and Recalcitrant Compounds
May 22-26, 2016
Palm Springs, CA
The Conference organized by Battelle will provide a robust technical program as well as the opportunity to network with environmental professionals from around the world. Attendance is expected to be 1,500 to 1,700 scientists, engineers, regulators, and other environmental professionals representing universities, government site management and regulatory agencies, and R&D and manufacturing firms from more than 30 countries.
Additional information on the conference is available at
https://www.battelle.org/media/conferences/chlorcon
Estimating LNAPL Transmissivity: A Guide to Using ASTM
Standard Guide E2856
Sep 27-28, 2016
Jersey City, NJ
The two day training will help build a critical foundation for understanding estimation of LNAPL Transmissivity (Tn). These concepts will teach you about the practical limits for hydraulic recovery of subsurface petroleum and create effective remedial strategies. You will learn how multiple occurrences of LNAPL (confined, perched, unconfined) affect LNAPL Tn, as well as discern which calculation methods are appropriate for each condition. Topics will include analyzing skimming test data, baildown test data, and previously collected remediation system data.
Additional information on the training is available at
https://www.astm.org/TRAIN/filtrexx40.cgi?-P+ID+193+traindetail.frm
An updated version of the ASTM Guide for Calculating LNAPL Transmissivity is Now Available for Purchase at www.astm.org.
ASTM Standard E2856 – Standard guide for Estimation of LNAPL Transmissivity is now available
The ASTM LNAPL Conceptual Site Model (LCSM) workgroup is actively updating the ASTM LCSM guidance document. If you are interested in participating on this team or would like to send comments for consideration – please contact Andrew Kirkman of BP Americas (team leader).
ANSR now has a companion group on LinkedIn that is open to all and is intended to provide a forum for the exchange of questions and information about NAPL science. You are all invited to join by clicking here OR search for “ANSR – Applied NAPL Science Review” on LinkedIn.
If you have a question or want to share information on applied NAPL science, then the ANSR LinkedIn group is an excellent forum to reach out to others internationally.