Applied NAPL Science Review
Demystifying NAPL Science for the Remediation Manager
Editor: Lisa Reyenga, PE
ANSR Scientific Advisory Board
J. Michael Hawthorne, PG, Board Chairman, GEI Consultants, Inc
Andrew J. Kirkman, PE, BP Americas
Robert Frank, RG, Jacobs
Paul Cho, PG, CA Regional Water Quality Control Board-LA
Randy St. Germain, Dakota Technologies, Inc.
Dr. Terrence Johnson, USEPA
Stephen S. Boynton, PE, LSP, Subsurface Env. Solutions, LLC
Dr. Randall Charbeneau, PE, University of Texas
Mark Lyverse, PG, Chevron Energy Technology Company
Douglas Blue, Ph.D., ExxonMobil Environmental & Property Solutions
Applied NAPL Science Review (ANSR) is a scientific ejournal that provides insight into the science behind the characterization and remediation of Non-Aqueous Phase Liquids (NAPLs) using plain English. We welcome feedback, suggestions for future topics, questions, and recommended links to NAPL resources. All submittals should be sent to the editor.
A Note from the Editors.
Applied NAPL Science Review (ANSR) is a scientific ejournal that provides practical scientific tools in plain English to understand and manage Non-Aqueous Phase Liquids (NAPLs). Mike founded ANSR in 2011 with the support and advice of an exceptional and diverse Board of NAPL experts from regulatory agencies, industry, academia, and consulting. ANSR’s early days coincided with the transition from using Light Non-Aqueous Phase Liquid (LNAPL) thickness as a primary metric for remediation toward other more advanced scientific tools. ANSR is a freely available, widely distributed mechanism to communicate the new science and to explore implications for NAPL site characterization and remediation.
After six years of publication, ANSR had thousands of subscribers from over 100 countries. The ANSR team took a temporary hiatus in 2018 and 2019, but now we are back and eager to once again freely share practical science, engineering, and technology tools with our readers.
As we prepare to re-launch ANSR, we took a moment to review the state of the industry in 2020 in comparison to 2011. Tools such as LNAPL transmissivity and understanding the hydrogeologic condition of LNAPL are now commonplace. “Plain English” guides to understand these concepts are available from Interstate Technology & Regulatory Council, American Petroleum Institute, ASTM International, and other sources. However, the state of NAPL science is no less exciting than it was in 2011. Cutting edge work with real, practical implication on site characterization and remediation is being done every day.
We have an exciting set of articles in preparation for quarterly publication in 2020. Moving forward, we will continue to publish on current NAPL subjects such as natural source zone depletion, NAPL mobility in sediment, surface water sheen discharge management, life cycle NAPL management, and applications for data automation at NAPL sites. As always, we welcome feedback, questions, suggestions for future topics, and article submissions. Here’s to a great start to 2020 and many more interesting articles communicating new NAPL science and its implications on NAPL site characterization and remediation.
DISCLAIMER: This article was prepared by the author(s) in their personal capacity. The opinions expressed in this article are the author’s own and do not necessarily reflect the views of Applied NAPL Science Review (ANSR) or of the ANSR Review Board members.
Monitored Natural Source Zone Depletion Measurement Frequency
GEI Consultants, Inc.
Natural Source Zone Depletion (NSZD) is the collective natural processes that reduce the mass, saturation, and mobility of light non-aqueous phase liquid (LNAPL) in the subsurface. These processes include volatilization, dissolution, and biodegradation. NSZD of the LNAPL begins from the moment the release occurs and understanding it is a critical component of the conceptual site model (CSM). Increasingly, NSZD is being evaluated as a remedial alternative to complement or replace engineered remedies (ITRC 2018). Where NSZD is being utilized as a deliberate remedy, it is referred to as monitored NSZD (MNSZD). An example of this progression is shown in Figure 1.

Multiple approaches are available for the monitoring portion of MNSZD (Figure 2). These methodologies infer NSZD is ongoing based on the byproducts of biodegradation, such as efflux of carbon dioxide (CO2) at the ground surface, gradients of gas concentrations or temperature in the subsurface, or changes in groundwater geochemistry (API 2017, ITRC 2018). Some methodologies provide qualitative or semi-quantitative data that confirms NSZD is ongoing (“NSZD screening”) while others can be utilized to estimate quantitative NSZD rates.
Figure 2 – NSZD Methodologies
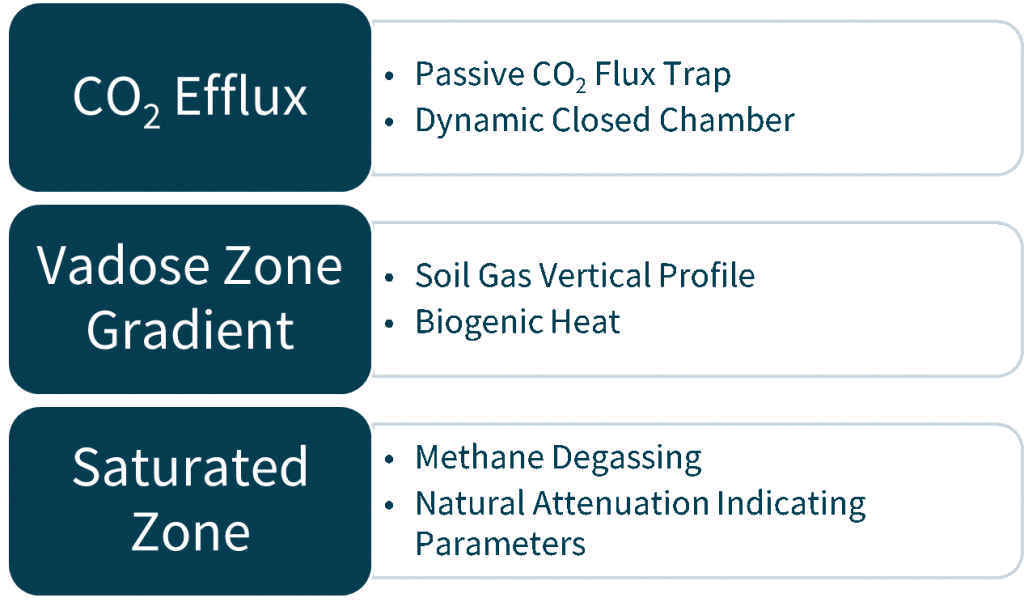
Estimating quantitative NSZD rates is typically utilized where the effectiveness of MNSZD as a remedy is being evaluated as a stand-alone remedy and/or compared to other remedial options. For example, to determine if the NSZD rate is sufficient to meet the remedial goals alone or to determine the appropriate time to transition the remedial action from MNSZD in conjunction with an engineered remedy to MNSZD as a stand-alone remedy. Where no numerical threshold evaluation is being performed, NSZD screening alone may be adequate.
Once MNSZD is accepted as part of the remedial approach, the stakeholders must determine how frequently to perform any ongoing evaluations to demonstrate remedial progress.
The factors controlling the variation in NSZD rate over time are an active area of research. Current research indicates that while short-term temporal variation is observed, the bulk NSZD rate is approximately constant over long periods of time. Evidence of “quasi-constant” NSZD rates are summarized in Garg et al. 2017 and are based on long-term laboratory studies, reactive transport models, and observations at the United State Geological Survey (USGS) Bemidji site (the initial and most studied site for NSZD of LNAPL).
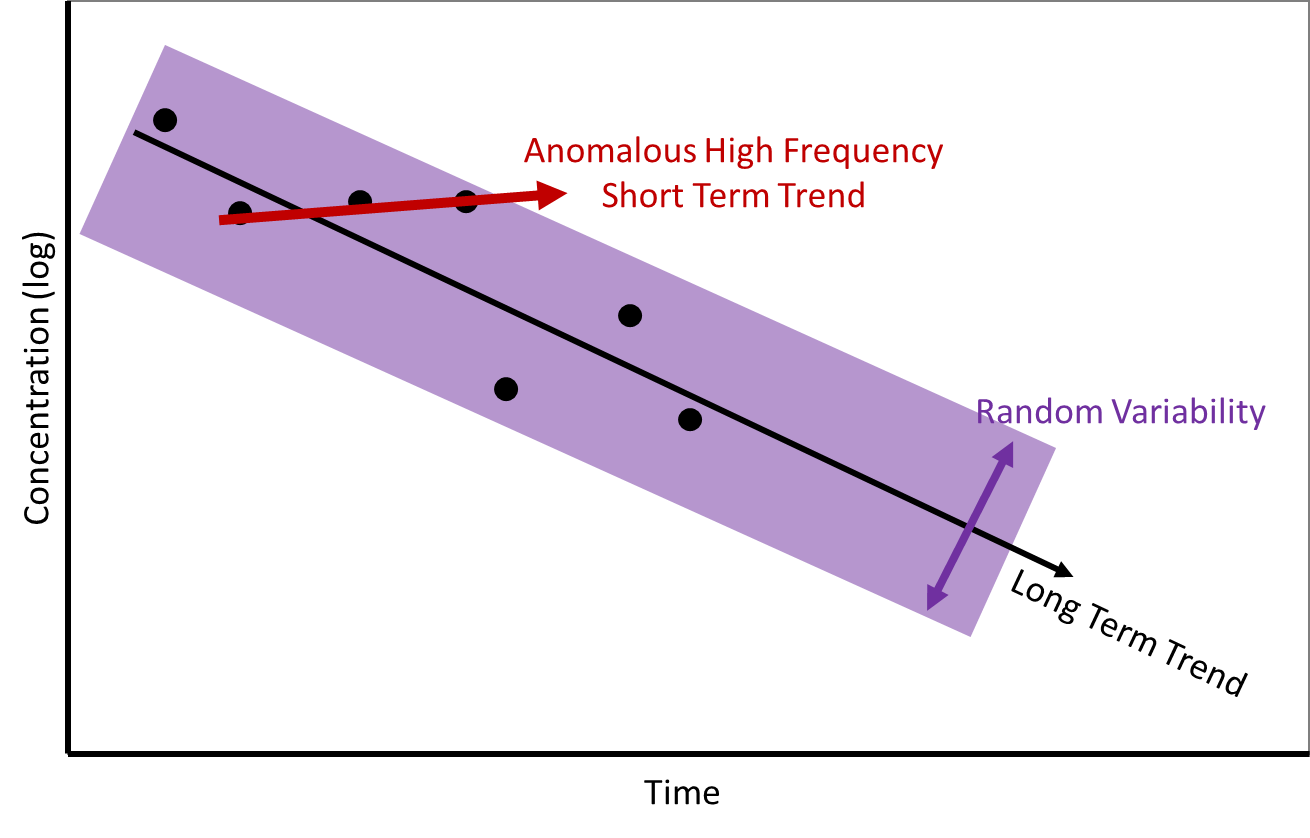
There are no overarching industry guidance documents that suggest measurement frequencies for MNSZD at this time. However, such documents are available for Monitored Natural Attenuation (MNA). These guidance documents indicate that high-frequency sampling is inappropriate and unnecessary to characterize long-term trends with time (Figure 3). High-frequency sampling captures random variability rather than the long-term trend (EPA 2011, ESTCP 2014, McHugh et al. 2011). Proposed appropriate monitoring periods are, for example, on 5-year intervals (ESTCP 2014). Given that NSZD rates change more gradually with time than the groundwater concentration data used for MNA, appropriate monitoring frequencies for MNSZD should be no more frequent than for MNA.
As a result, MNSZD monitoring programs are starting to follow several typical patterns to demonstrate remedial progress.
Programs requiring quantitative MNSZD evaluations typically involve a “baseline” evaluation to establish the NSZD rate. This evaluation may involve multiple events to optimize the MNSZD approach and evaluate site-specific variations (e.g. appropriate measurement methodologies, significance of seasonal fluctuations). Once the MNSZD program is established, the measurement frequency decreases.
Programs based on NSZD screening are typically conducted more frequently. There is no technical reason that NSZD screening needs to be conducted more often than quantitative methods. However, where the stakeholders require more frequent monitoring, NSZD screening is an option that is easier to implement and less costly than the quantitative methods.
Therefore, when developing long-term monitoring plans for MNSZD, consider that the NSZD rate is likely to remain relatively constant for years or possibly even decades depending on the source of the material and site conditions. Where it is only required to confirm that NSZD is ongoing, NSZD screening may be sufficient. Where a quantitative evaluation is required, consider that the appropriate monitoring frequency to reliably identify a trend in NSZD rate will likely be relatively long intervals (e.g. every 5 to 10 years) in comparison to typical groundwater monitoring programs.
A thorough understanding of the site conceptual model and the regulatory environment is required to effectively implement MNSZD as a remedy at a site. While MNSZD is generally ongoing at all LNAPL release sites, and is an important driver toward remedial goals, careful evaluation is required to determine if MNSZD alone is a sufficient remedy to protect human health and the environment. The effectiveness of MNSZD may still be monitored more frequently through other compliance monitoring of specific exposure routes. The appropriate monitoring frequency for these exposure routes should be evaluated separately from the evaluation of MNSZD frequency.
References:
API, 2017. Quantification of Vapor Phase-related Natural Source Zone Depletion Processes. API Publication 4784, First Edition, May 2017. American Petroleum Institute, 124 pp. https://www.techstreet.com/standards/api-publ-4784?product_id=1984357
Adamson, D.T., and C.J. Newell. (ESTCP) 2014. Frequently Asked Questions about Monitored Natural Attenuation in Groundwater. ESTCP Project ER-201211. Environmental Security and Technology Certification Program, Arlington, Virginia.
Garg, Sanjay, Charles J. Newell, Poonam R. Kulkarni, David C. King, David T. Adamson, Maria Irianni Renno, and Tom Sale, 2017. Overview of Natural Source Zone Depletion: Processes, Controlling Factors, and Composition Change. Groundwater Monitoring & Remediation 37, no. 3/ Summer 2017/pages 62–81.
ITRC, 2018. Light Non-Aqueous Phase Liquids (LNAPL) Document Update: Evaluating and Implementing LNAPL Remedial Technologies. Interstate Technology Regulatory Council, LNAPL Update Team, pending publication March 2018. https://www.itrcweb.org/Team/Public?teamID=73
John T. Wilson. (EPA) 2011. An Approach for Evaluating the Progress of Natural Attenuation in Groundwater. EPA 600/R-11/204. United States Environmental Protection Agency Office of Research and Development National Risk Management Research Laboratory Ada, OK, December 2011.
McHugh, T.E., L.M. Beckley, C.Y. Liu, and C.J. Newell, 2011. Factors Influencing Variability in Groundwater Monitoring Data Sets. Groundwater Monitoring & Remediation 31, no. 2/ Spring 2011/pages 92–101.
Research Corner

Thank you to Dr. Tom Sale of the Colorado State University, Center for Contaminant Hydrology, for providing access to selected graduate level NAPL research.
Thermal Monitoring of Natural Source Zone Depletion
Kayvan Karimi Askarani
Doctor of Philosophy
Colorado State University
Abstract:
Natural Source Zone Depletion (NSZD) has emerged as a viable remedial approach for mature releases of petroleum liquids in soils and groundwater. Herein, petroleum liquids in soils and groundwater are referred to as LNAPL. In recent years, gradient, dynamic chamber, and carbon trap methods have been developed to quantify NSZD rates based on measuring the consumption of O2 or the generation of CO2 associated with biodegradation of LNAPL. A promising alternative approach to resolving LNAPL NSZD rates is real-time monitoring of subsurface temperatures. Transformation of temperature data to NSZD rates involves use of background-corrected temperature data, energy balances to resolve NSZD energy, and an estimate of heat produced through NSZD. All current computational methods for quantifying NSZD rates using temperature data have the drawbacks of: 1) incomplete energy balances, 2) ignoring the effect of water table fluctuation, and 3) using linear extrapolations of temperature profiles to calculate thermal gradients. A regression algorithm is advanced to overcome the primary drawbacks of current computational methods that convert subsurface temperature data to NSZD rates using background correction. The regression algorithm is demonstrated using 42 million temperature measurements from a fuel terminal. An 8% difference between NSZD rates from the CO2 Trap method and the regression algorithm supported the validity of regression algorithm for estimation of NSZD rates using subsurface temperatures. In addition, seasonal behavior of NSZD rates is captured and correlated water content in shallow soils and depth to the water table. It is concluded that as the water table rises, the apparent NSZD rates increase, while larger water content in shallow soil causes a reduction in the apparent NSZD rates. Imperfection with background-correction approaches can be attributed to many factors, including differing infiltration of precipitation, vegetative cover, soil properties, and net solar radiation, at background versus impacted locations. Differences between the background location and the impacted area cause anomalous background-corrected temperatures leading to over/under estimation of NSZD rates. A new computational model is developed to eliminate the need for background correction of temperature data in calculating NSZD rates. Since the new model uses only the temperature data collected from the temperature sensors attached to a single solid stick, the model is referred to as the “single stick” method. The validity of the single stick model is evaluated using a numerical model and field temperature data. Agreement between the results from a numerical model with imposed heat fluxes, and estimated heat fluxes using temperature data derived from the numerical model, supports the validity of single stick model. In addition, a close match between single stick simulated temperatures using estimated heat fluxes and actual measure temperatures supports the validity of the single stick model. Furthermore, comparison of NSZD rates from the single stick model with the rates from background correction methods at background locations shows that the single stick model is the only algorithm that consistently provides near zero NSZD rates in clean areas. Lastly, per thermodynamic calculations and preliminary lab studies, it is observed that negative NSZD rates may be due to endothermic methanogenic process. Thermal conductivity is one of the key input parameters for all computational methods converting temperature data to NSZD rates. An integrated Internet of Things (IoT) instrument and computational model is developed to measure real-time in-situ thermal conductivity of soils. Favorable agreement between measure ex-situ and in-situ thermal conductivities values supports the validity of the demonstrated in-situ techniques for estimating thermal conductivities. Favorable attributes of the new in-situ methods include lower cost, automated data acquisition, and an ability to acquire in-situ estimates of thermal conductivities through time. Overall, this work demonstrated that monitoring subsurface temperature is a viable technique to resolve NSZD rates for LNAPLs. A promising next step for evaluating the validity of thermal NSZD rates is to periodically collect and analyze cryogenic cores from field sites to independently validate NSZD rates. Further work is needed to better resolve NSZD thermodynamics.
The primary objective of ANSR is the dissemination of technical information on the science behind the characterization and remediation of Light and Dense Non-Aqueous Phase Liquids (NAPLs). Expanding on this goal, the Research Corner has been established to provide research information on advances in NAPL science from academia and similar research institutions. Each issue will provide a brief synopsis of a research topic and link to the thesis/dissertation/report, wherever available.
Related Links
API LNAPL Resources
ASTM LCSM Guide
Env Canada Oil Properties DB
EPA NAPL Guidance
ITRC LNAPL Resources
ITRC LNAPL Training
ITRC DNAPL Documents
RTDF NAPL Training
RTDF NAPL Publications
USGS LNAPL Facts
ANSR Archives
Coming Up
In coming newsletters, look for more articles on natural source zone depletion as well as NAPL mobility in sediment, surface water sheen discharge management, lifecycle NAPL management, and applications for data automation at NAPL sites.
Announcements
Upcoming Training – Learn More Here: https://www.itrcweb.org/Training
- April 14: LNAPL Conceptual Site Models and the LNAPL Decision Process
- April 14: Connecting the Science to Managing LNAPL Sites Part 2: LNAPL Conceptual Site Models and the LNAPL Decision Process
- April 28: Connecting the Science to Managing LNAPL Sites Part 3: Using LNAPL Science, the LCSM, and LNAPL Goals to Select an LNAPL Remedial Technology
- April 28: Using LNAPL Science, the LCSM, and LNAPL Goals to Select an LNAPL Remedial Technology
- May 19: Bioavailability of Contaminants in Soil: Considerations for Human Health Risk Assessment
- May 21: Optimizing Injection Strategies and In Situ Remediation Performance
- June 9: TPH Risk Evaluation at Petroleum-Contaminated Sites
- June 11: Remediation Management of Complex Sites
ANSR now has a companion group on LinkedIn that is open to all and is intended to provide a forum for the exchange of questions and information about NAPL science. You are all invited to join by clicking here OR search for “ANSR – Applied NAPL Science Review” on LinkedIn. If you have a question or want to share information on applied NAPL science, then the ANSR LinkedIn group is an excellent forum to reach out to others internationally.