Applied NAPL Science Review
Demystifying NAPL Science for the Remediation Manager
Editor: J. Michael Hawthorne, PG
Asst. Editor: Dr. Rangaramanujam Muthu
ANSR Scientific Advisory Board
J. Michael Hawthorne, PG, Board of Chairman, GEI Consultants Inc.
Mark Adamski, PG, BP Americas
Stephen S. Boynton, PE, LSP, Subsurface Env. Solutions, LLC
Dr. Randall Charbeneau, University of Texas
Paul Cho, PG, CA Regional Water Quality Control Board-LA
Robert Frank, RG, CH2M
Dr. Sanjay Garg, Shell Global Solutions (US) Inc.
Randy St. Germain, Dakota Technologies, Inc.
Dr. Dennis Helsel, Practical Stats
Dr. Terrence Johnson, USEPA
Andrew J. Kirkman, PE, BP Americas
Mark Lyverse, PG, Chevron Energy Technology Company
Mark W. Malander, ExxonMobil Environmental Services
Applied NAPL Science Review (ANSR) is a scientific ejournal that provides insight into the science behind the characterization and remediation of Non-Aqueous Phase Liquids (NAPLs) using plain English. We welcome feedback, suggestions for future topics, questions, and recommended links to NAPL resources. All submittals should be sent to the editor.
Measuring LNAPL Degradation
Rates using CO2 Flux Methods
Julio Zimbron, PhD – Colorado State University
Charles D. Stone, PE, PG – GEI Consultants, Inc.
Background
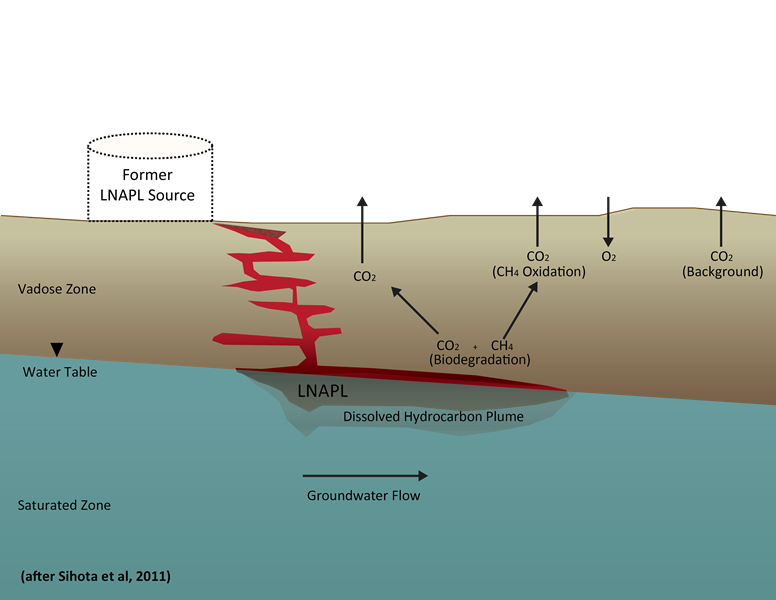
Biodegradation of petroleum hydrocarbon in soils is well documented [1],[5]. Typically, microbes use electron acceptors in the soil such as oxygen, sulfate, or iron to mineralize the petroleum (transform it to carbon dioxide). However, even when these electron acceptors are absent, petroleum can still degrade through a process called methanogenesis [7] in which microbes generate methane (CH4) and carbon dioxide (CO2). The fact that methanogenesis is an ubiquitous process at petroleum-impacted sites can be demonstrated by measuring CH4 and CO2 concentrations in soil gas near petroleum sources [2],[7].
Natural source zone depletion (NSZD) [7], also known as source zone natural attenuation (SZNA) [11], is the degradation of petroleum hydrocarbon in the subsurface due to dissolution of some of the petroleum into groundwater, partitioning of volatiles into soil gas, and biodegradation of a fraction that is either in groundwater, sorbed to the soil, or in the soil gas. It turns out that the majority of this degradation results in generation of CH4 and/or CO2. The amount of petroleum being degraded can be estimated by measuring the amounts of CH4 and CO2 that are produced.
The term NSZD is used here to avoid confusion with the association of natural attenuation, which pertains to the quantitative evaluations of dissolved groundwater plume remediation [4],[6].
Soil Gas CO2 Flux Measurement
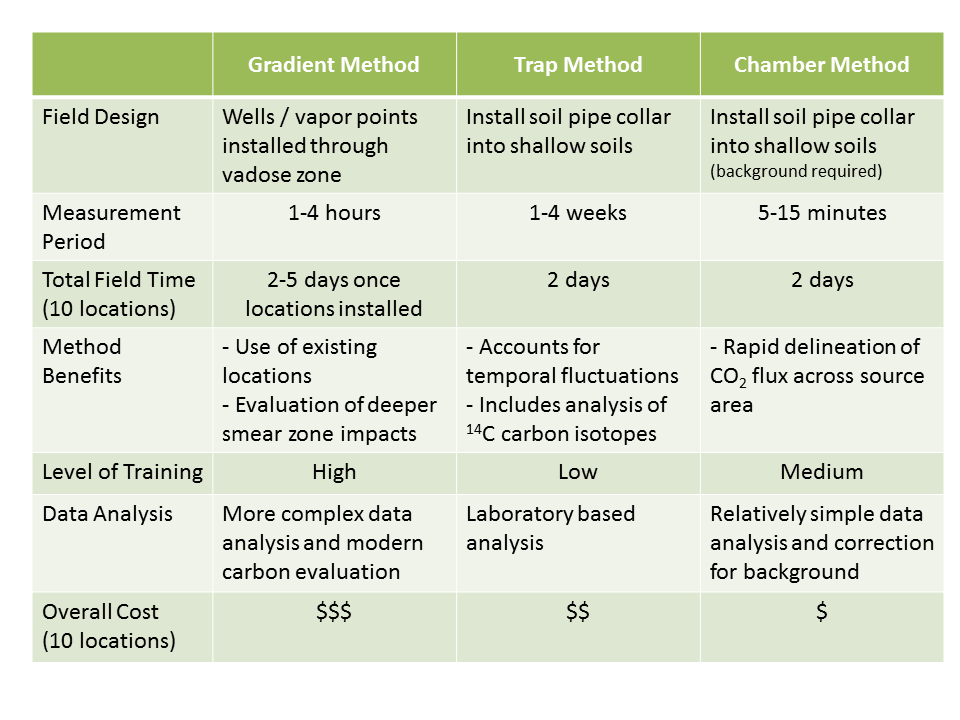
The three methods described here are used to estimate rates of CO2 mass produced from subsurface degradation of light non-aqueous phase liquid (LNAPL) petroleum hydrocarbons that is transferred across a specific area (a reference plane). Mass transport through a unit area is referred to as flux (M/L2/T), which can be applied to an LNAPL body footprint. The two surface methods provide an estimate of CO2 mass flux that originates from a subsurface LNAPL body and moves through a surficial reference plane. The gradient method requires the determination of effective vapor-phase diffusion coefficients [11] for CO2 in the various layers of vadose zone soil for estimating CO2 mass flux. The total CO2 mass flux is found by using single point measurements to estimate flux values over the entire LNAPL body footprint area.
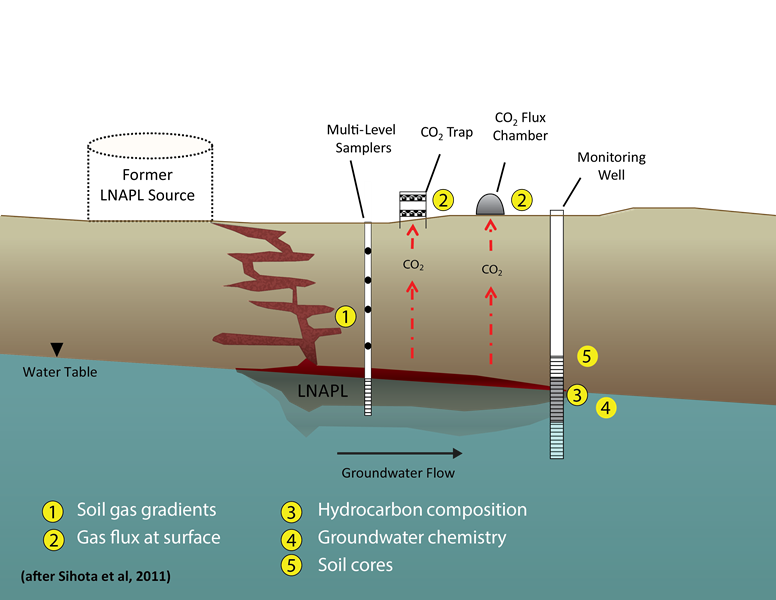
CO2 flux can be quantified with the following methods as shown on Figure 2:
- The gradient method [9];
- Use of carbon traps [12]; and
- Chamber methods [11,12].
Sub Surface Method
Gradient Method
One way to estimate the amount of petroleum being degraded is to measure CO2 concentrations at various depths in the vadose zone above the LNAPL body. The change in CO2 concentrations with depth (a concentration gradient) is used together with measured or estimated diffusion coefficients to estimate a total CO2 mass flux (from all sources present in the measurement interval) [10]. To estimate only the fraction of gases related to LNAPL biodegradation, the amount of other CO2 contributions (i.e., modern carbon from the root zone) needs to be verified to be negligible or else quantified in some other way (i.e., the use of carbon isotopes at the impacted location in question or measurement of CO2 flux at unimpacted locations).
Surface Methods
Carbon Traps
Passive soil gas traps capture the CO2 as it leaves the ground at the ground surface to measure a time-averaged CO2 flux over the period of deployment [12]. The traps are deployed over a previously installed collar. The traps are open to the atmosphere and have a double layer of sorbent to prevent cross-contamination of the CO2 flux from the soil with atmospheric CO2[12]. Once recovered from the field, the traps are analyzed in the laboratory. The cumulative CO2 mass is carbon dated to determine the total CO2 flux originating from fossil fuel carbon sources (i.e., resulting from petroleum biodegradation) versus modern sources (deriving from natural plant and soil activity) [3], which allows this method to only account for gases related to LNAPL biodegradation.
Chamber Method
Chambers provide a way to measure CO2 flux at ground surface across a LNAPL body. Prior to measurement, PVC collars are installed into the soil across the LNAPL plume and at background locations outside of the impacted area [8]. The chamber takes a few minutes to collect a CO2 flux measurement at each collar location and can be moved from collar to collar across the LNAPL plume and vicinity to understand lateral variations. Longer-term CO2 flux measurements (days, weeks, or months) can be collected by conducting repeated measurements to understand temporal variations due to changes in soil conditions and climate. Assuming the modern carbon fluxes are similar at both impacted and unimpacted locations, the CO2 flux, due to LNAPL degradation, can be quantified by subtracting natural background CO2 flux contributions (i.e., modern) from total CO2 flux measurements.
Data Interpretation and Use
Once CO2 flux is measured (by any of the methods described above), the measurement can be converted into estimated LNAPL losses by assuming both a representative molecular weight and a fluid density for the petroleum present at the site to stoichiometrically convert the CO2 flux to an equivalent mass loss rate from the LNAPL body.
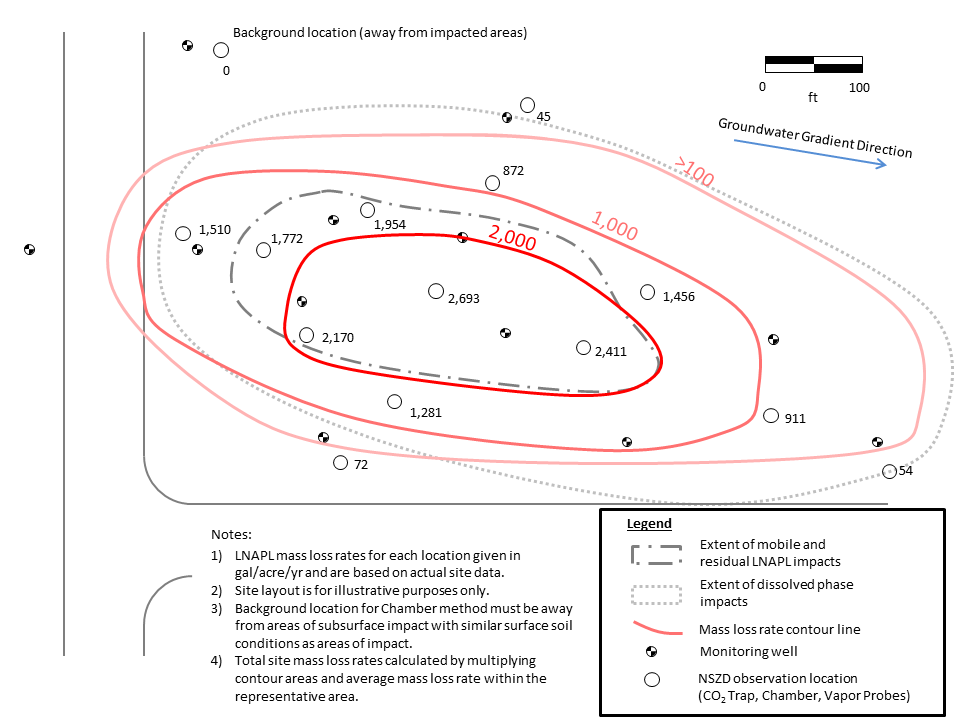
Contour plots of CO2 flux and/or LNAPL degradation rate (e.g., gallons per acre per year of LNAPL degradation) can show the spatial distribution of LNAPL degradation to support estimation of site-wide LNAPL mass loss rates due to NSZD processes. The LNAPL mass loss rate contour map below (Figure 3) is real/actual site data overlaid onto a generic site layout. The average LNAPL mass loss rate of ~1,400 gallons per acre per year, for the example site, is consistent with real-world site data, and would result in a total site-specific LNAPL mass loss of approximately 7,000 gallons per year.
LNAPL mass loss rates are labeled by each measurement point and contoured in red.
CO2 flux measurement methods and estimates of natural LNAPL mass loss rate to the vadose zone can be useful in development of a LNAPL remedial strategy. LNAPL mass loss rates due to NSZD processes can provide a baseline from which to evaluate benefits of other LNAPL recovery technologies and remedial approaches. Further, longer-term monitoring of CO2 flux may also provide data to demonstrate the ability of natural processes to mitigate residual site impacts at sites where active remedies (such as hydraulic LNAPL recovery or soil vapor extraction) have been exhausted and are no longer effective.
Limitations
The methods described here are first principles-based and have undergone different levels of lab and field validation. As such, it is widely accepted that they provide an order of magnitude estimate for the rate of NSZD. Like any other soil measurement techniques, they are sensitive to special variability and site heterogeneity. Interpretation of CO2 flux data should consider site-specific conditions that may influence CO2 flux during the data collection process. For example significant depths, complex subsurface heterogeneities, preferential pathways, and/or surface barriers (e.g., concrete pads) may adversely impact the applicability of these methods. Measurement of CO2 flux can provide valuable insights into NSZD processes that should be evaluated within the context of an overall LNAPL conceptual site model
References:
[1] Alexander, M., 1977. Introduction to Soil Microbiology, Second Edition. John Wiley & Sons, New York, NY.
[2] Amos R.T., Mayer K.U., Bekind B.A., Delin G.N., and Williams R.L. 2005 Use of dissolved and vapor-phase gases to investigate methanogenic degradation of petroleum hydrocarbon contamination in the subsurface, Water Resources Research 41, pp
[3] ASTM International Standard Method D-6866: Standard test methods for determining the biobased content of solid, liquid, and gaseous samples using radiocarbon analysis, West Conshohocken, PA: ASTM International
[4] ASTM International Standard Method E1943-98: Standard Guide for Remediation of Groundwater by Natural Attenuation at Petroleum Release Sitesting and Materials, West Conshohocken, PA: ASTM International
[5] DeVaull, G.E., R.A. Ettinger, and J.B. Gustafson. 2002. Chemical Vapor Intrusion from Soil or Groundwater to Indoor Air: Significance of Unsaturated Zone Biodegradation on Aromatic Hydrocarbons. Soil and Sediment Contamination11, No. 4, Pages 625-641.
[6] EPA 2001 Monitored Natural Attenuation: USEPA Research Program – An EPA Science Advisory Board Review, EPA-SAB-EEC-01-004, U.S. Environmental Protection Agency, Science Advisory Board, Washington DC.
[7] Hers I, Atwater J., Li L., and Zapf-Gilje R. 2000 Evaluation of vadose zone biodegradation of BTX vapors, Journal of contaminant Hydrology 46, pp 233-264.
[8] Hutchinson, G.L. and Livingston, G.P. 2002 Soil–atmosphere gas exchange. In Dane, J.H. and Topp, G.C. (Eds.), Methods of Soil Analysis, Part 4, SSSA Book Series 5, SSSA, Madison, WI, USA, pp 1159–1182.
[9] ITRC (Interstate Technical Regulatory Council) 2009 Evaluating Natural Source Zone Depletion at sites with LNAPL, LNAPL-1.
[10] Johnson, P.C., C. Bruce, R.L. Johnson, and M.W. Klemblowski. 1998. In situ measurement of effective vapor-phase porous medium diffusion coefficients, Environmental Science and Technology 32, no.21, p.3405-3409.
[11] Johnson P., P. Lundegard, and Z. Liu. 2006. Source zone natural attenuation at petroleum hydrocarbon spill sites – I: Site-specific assessment approach, Ground Water Monitoring and Remediation 26, pg 82 – 92.
[12] McCoy K., Zimbron J, Sale T. and Lyverse M. 2014 Measurement of natural losses of LNAPL using CO2 traps, Groundwater, doi: 10.1111/gwat.12240
[13] Sihota N.J., Singurindy O., and Mayer K.U. 2011 CO2-efflux measurements for evaluating source zone natural attenuation rates in a petroleum hydrocarbon contaminated aquifer, Environmental Science and Technology 45, p 482-488.
[14] Sihota N.J. and Mayer K.U. 2012 Characterizing vadose zone hydrocarbon biodegradation using carbon dioxide effluxes, isotopes and reactive transport modeling, Vadose Zone Journal, doi:10.2136/vzj2011.0204.
Research Corner

Thank you to Dr. Tom Sale of the Colorado State University, Center for Contaminant Hydrology, for providing access to selected graduate level NAPL research.
Biogeochemical Characterization of a LNAPL Body in Support of STELA
Maria Irianni Renno
Master of Science
Colorado State University
Abstract: Microbially-mediated depletion of light non-aqueous phase liquids (LNAPL) has gained regulatory acceptance as a method for managing impacted sites. However, the fundamental microbiology of anaerobic hydrocarbon degradation, in source zones, remains poorly understood. Two site-specific studies (Zeman, 2012 & McCoy, 2012) performed at the Center for Contaminant Hydrology (CCH), Colorado State University (CSU) demonstrated that LNAPL biodegradation increases drastically when temperatures are maintained between 18°C and 30°C as compared to lower or higher temperatures. These results have supported the design of a Sustainable Thermally Enhanced LNAPL Attenuation (STELA) technology that is currently being tested at field scale at a former refinery in Wyoming. The focus of the present study was to perform a depth-resolved characterization of the mixed microbial communities present in LNAPL-impacted soils, as well as to characterize the site’s geochemical parameters in order to establish a baseline data set to evaluate the STELA system performance. Seventeen soil cores were collected from the impacted site, frozen on dry ice and subsampled at 6-inch intervals for analysis of biogeochemical parameters. Multi-level sampling systems were installed at the core sites to monitor aqueous and gas phases. Diesel and gasoline range organics and benzene, toluene, ethylbenzene and xylenes (BTEX) present in the cores and in water samples were analyzed. Temperature, inorganic dissolved ions, pH, and oxidation reduction potential (ORP) were also measured. DNA was extracted in triplicate from each subsample corresponding to the study’s center core (21 samples). Total Eubacteria and Archaea were quantified via 16S rRNA gene-targeted qPCR. Microorganisms present at selected depth intervals were identified via 454 pyrosequencing of both eubacterial and archaeal 16S rRNA genes. Results indicate that at the study site, the majority of the hydrocarbon contamination is found between 5 and 12 feet below ground surface (bgs). The average of the maximum total petroleum hydrocarbon (TPH) soil concentrations within each core was 17,800 mg/kg with a standard deviation of 8,280 mg/kg. The presence of methane in the vadose zone and depleted sulfate concentrations in water samples suggest that both methanogenesis and sulfate reduction are likely driving LNAPL depletion processes. Four distinct biogeochemical zones where identified within the surveyed aquifer region. Interestingly, the quantity of eubacterial 16S rRNA genes dominate the quantity of archaeal 16S rRNA genes at sampled depths within the aerobic aquifer region. In the strictly anaerobic aquifer regions, these quantities are approximately equal. The latter can be interpreted as evidence of syntrophism, which has been reported in other hydrocarbon biodegradation studies. Pyrosequencing results support these findings as well and contribute to further elucidating the spatial correlation between microbial communities and geochemical parameters. In-situ biodegradation rates are largely controlled by the quantity and activity of key microbes capable of mediating conversion of specific hydrocarbon constituents. Furthermore, it is anticipated that biodegradation rates are governed by complex interactions of diverse microbial communities that vary both in space and time. The overall vision of this initiative is that advancing a better understanding of processes controlling biologically mediated losses of LNAPL will support the development of more efficient treatment technologies for LNAPL releases. In particular, the site specific analysis produced through this study will support the development of STELA.
The primary objective of ANSR is the dissemination of technical information on the science behind the characterization and remediation of Light and Dense Non-Aqueous Phase Liquids (NAPLs). Expanding on this goal, the Research Corner has been established to provide research information on advances in NAPL science from academia and similar research institutions. Each issue will provide a brief synopsis of a research topic and link to the thesis/dissertation/report, wherever available.
Practical Stats
Top Twelve Tip #5:
The hardest thing for a human being to do
Dr. Dennis Helsel
www.practicalstats.com
Hypothesis tests have come under fire in recent years. Recommendations by a few journals have been that the result of a test, called the “p-value”, should not be included in any article. This is a bit like burning books – knowledge is dangerous to some people. What a p-value does is to encourage a human to do the hardest thing possible for us – make a decision.
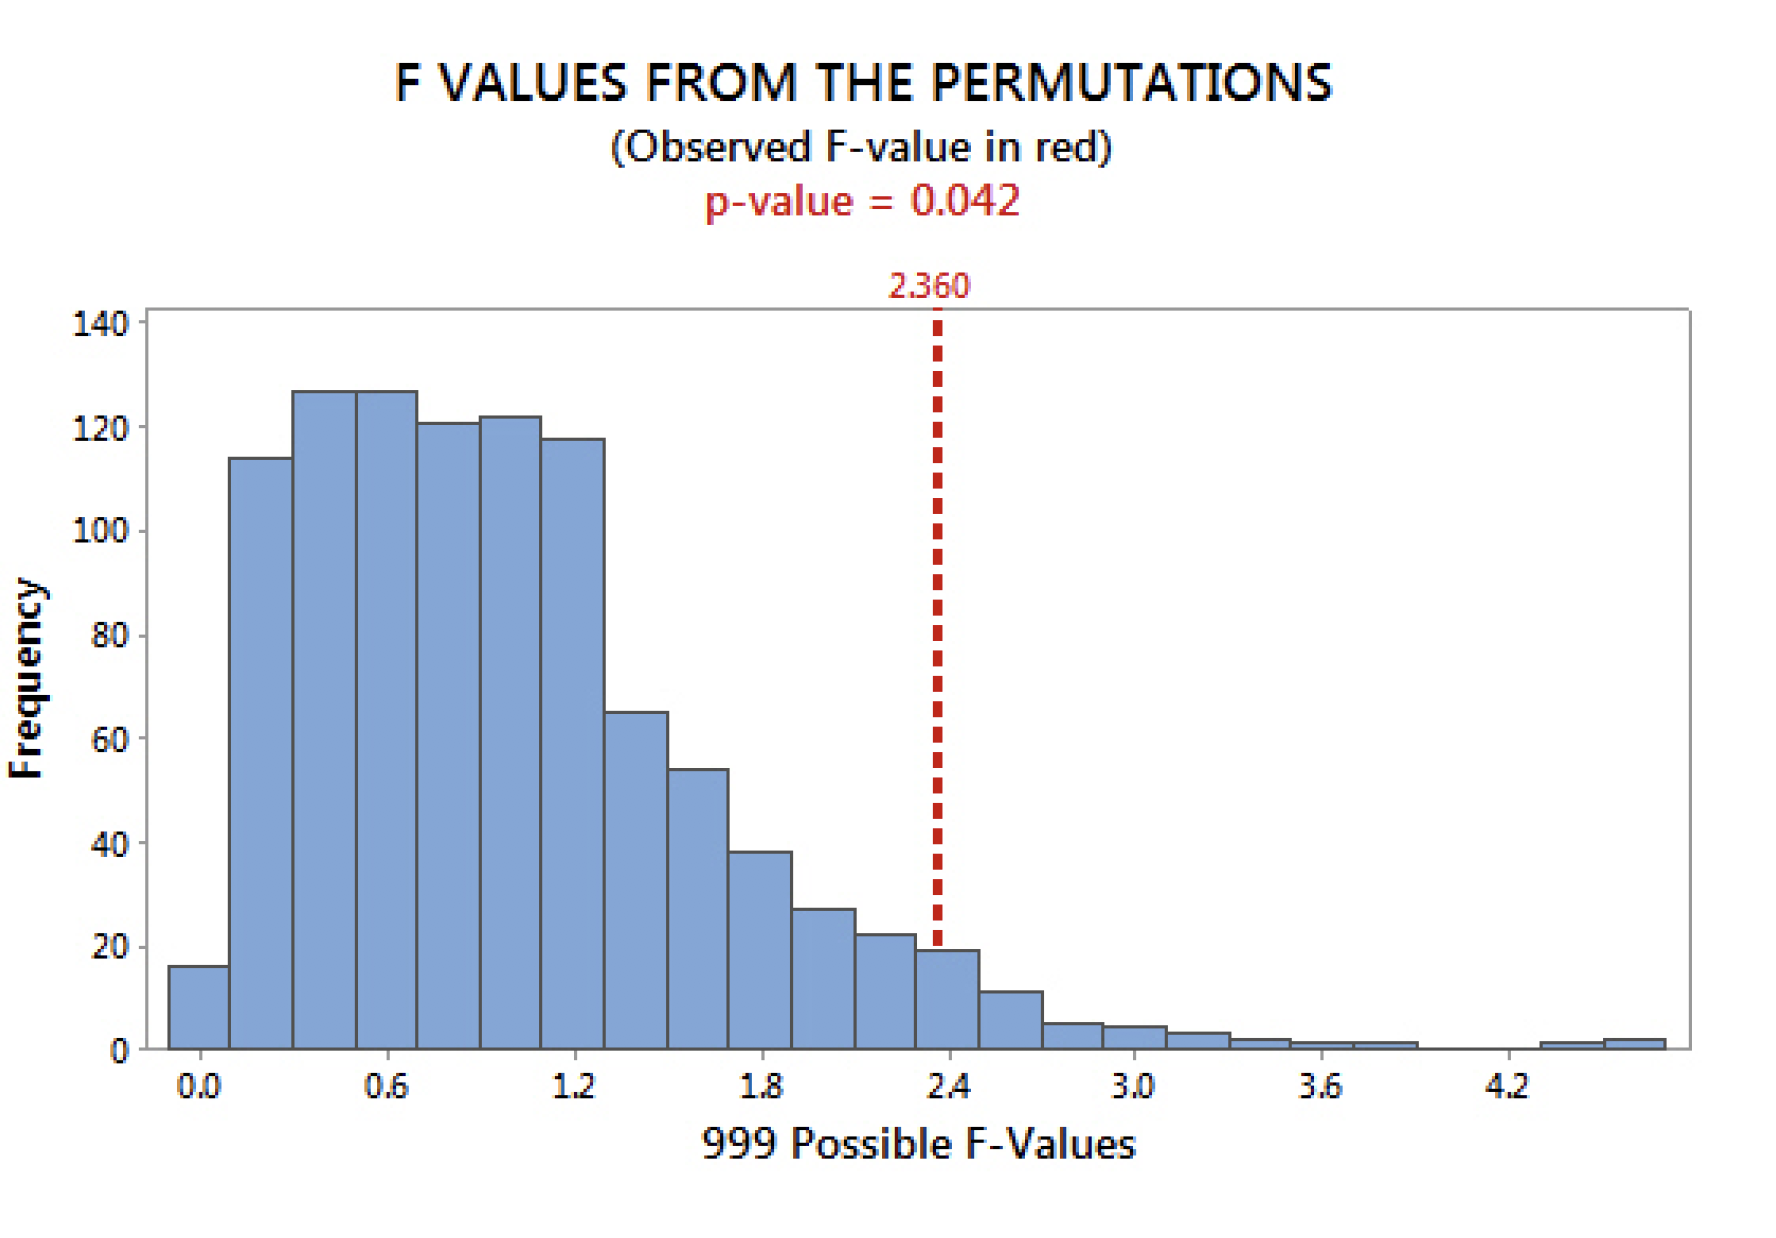
Hypothesis tests all work in a similar fashion. It shouldn’t be as confusing as it often seems. The “null hypothesis” is the ‘no signal’ situation: no difference between groups, no correlation, no trend. In the figure below, it is represented by the blue histogram of possible test results. These are the results possible when there is no difference in the mean concentration between four groups. The vertical dashed line is the test statistic from our data set of concentrations at four specific sites. Note that our test statistic of 2.360 is at the upper end of the histogram values. It is possible, but not likely, that our test statistic could result from a situation where there actually is no difference in the mean concentrations at the four sites. Possible, but not likely. How likely? That is the p-value. As the p-value gets smaller, the ‘no signal’ situation is less and less believable. In this case the p-value is 0.042, a 4.2% chance.
Based on the p-value from the data, the scientist decides that ‘no difference’ is sufficiently unlikely, and rejects it — the data indicate a difference is present. The groups likely have different mean concentrations. How small is a small enough p-value to declare there is a difference? When p is less than “alpha”, the probability of falsely declaring there is a difference, a signal, when in fact there is none in the field. Alpha is the rate of false positives. Historically alpha has been set at 0.05, 5 percent. Alpha doesn’t have to be at 0.05, it is only tradition, and can be reset by the scientist or by regulation. It must be set by someone before the data are collected. Otherwise, we’ll never make that decision. The p-value is the summary of the data’s signal strength (smaller is stronger). Alpha is the tool to enable a human to do what is hardest for us — make a decision!
Related Links
API LNAPL Resources
ASTM LCSM Guide
Env Canada Oil Properties DB
EPA NAPL Guidance
ITRC LNAPL Resources
ITRC LNAPL Training
ITRC DNAPL Documents
RTDF NAPL Training
RTDF NAPL Publications
USGS LNAPL Facts
ANSR Archives
Coming Up
Look for more articles on LNAPL transmissivity as well as additional explanations of laser induced fluorescence, natural source zone depletion and LNAPL Distribution and Recovery Modeling in coming newsletters.
Announcements
The 25th National Tanks Conference and Expo
September 14-16, 2015
Phoenix, AZ
Details at https://www.neiwpcc.org/tanksconference/index.asp
The National Tanks Conference and Exposition is produced by the New England Interstate Water Pollution Control Commission, in conjunction with the U.S. Environmental Protection Agency’s Office of Underground Storage Tanks, the Association of State and Territorial Solid Waste Management Officials, and the host state.
The purpose of this event is to provide learning and networking opportunities for federal, state, and tribal colleagues in the underground storage community. The focus is on progress, priorities, and plans for the pursuit of a common goal–to find new and better ways to work together to protect human health and the environment from tank releases.
PRE-CONFERENCE WORKSHOP
Improved LNAPL Assessment/Remedy Selection
September 13, 2015
1:00 PM – 5:00 PM
This workshop will demonstrate powerful, readily available forensic techniques to improve LNAPL remedy success by substantially improving LNAPL Conceptual Site Model Scientific Reliability. Discussions will include the range and distribution of LNAPL transmissivity values to provide practitioners and regulators with the context and scale within which to implement this critical metric.
The workshop will be jointly presented by J. Michael Hawthorne, Principial and Vice President at GEI Consultants, Inc. and Dr. Jun Lu, Senior Technical Leader at AECOM.
The 31st Annual International Conference on Soils,
Sediments, Water, and Energy
October 19-22, 2015
Amherst, MA
Details at https://www.aehsfoundation.org/east-coastconference.aspx
The Annual Conference on Soils, Sediments, Water, and Energy, at the University of Massachusetts at Amherst has become the preeminent national conference in this important environmental area. The conference attracts 600-800 attendees annually which includes a wide variety of representation from state and federal agencies; military; a number of industries including railroad, petroleum, transportation, utilities; the environmental engineering and consulting community; and academia.
Applied Environmental Statistics
September 14-18, 2015
Lynnwood, WA
Details at https://www.practicalstats.com/aes/Outline.html
The one-week course taught by Dr. Dennis Helsel provides training on various topics on environmental statistics including data description, urban legends, hypotheses tests, statistical intervals, data comparison, correlation, regression, covariance, trend analysis, and handling non-detect data.
ITRC 2-DAY CLASSROOM TRAINING:
Petroleum Vapor Intrusion: Fundamentals of Screening, Investigation, and Management
August 31 – September 1, 2015
Cary, NC
Register now at https://www.regonline.com/builder/site/Default.aspx?EventID=1713147
The Interstate Technology and Regulatory Council (ITRC) is offering 2-day training classes from the ITRC LNAPL team. ITRC offers this 2-day classroom training course, based on ITRC’s Technical and Regulatory Guidance document, Petroleum Vapor Intrusion: Fundamentals of Screening, Investigation, and Management (PVI-1,2014). This 2-day ITRC LNAPL classroom training led by internationally recognized experts should enable you to:
- Develop on-the-job skills to screen-out petroleum sites based on the scientifically-supported ITRC strategy and checklist.
- Focus the limited resources investigating those PVI sites that truly represent an unacceptable risk.
- Communicate ITRC PVI strategy and justify science based decisions to management, clients, and the public.
- Understand the essential principles of biodegradation and the fundamentals of vapor movement through the vadose zone.
- Appreciate the important role of modeling in the investigation of petroleum sites.
- Recognize the extensive options for investigating and mitigating PVI sites.
Light Nonaqueous-Phase Liquids (LNAPL): Science, Management, and Technology
September 15-16, 2015
Seattle, WA
Light Nonaqueous-Phase Liquids (LNAPL): Science, Management, and Technology
November 18-19, 2015
Austin, TX
The Interstate Technology and Regulatory Council (ITRC) is offering 2-day training classes from the ITRC LNAPL team. ITRC offers this 2-day classroom training course, based on ITRC’s Technical and Regulatory Guidance document, Evaluating LNAPL Remedial Technologies for Achieving Project Goals (LNAPL-2). This 2-day ITRC LNAPL classroom training led by internationally recognized experts should enable you to:
- Develop and apply an LNAPL Conceptual Site Model (LCSM)
- Understand and assess LNAPL subsurface behavior
- Develop and justify LNAPL remedial objectives including maximum extent practicable considerations
- Select appropriate LNAPL remedial technologies and measure progress
- Use ITRC’s science-based LNAPL guidance to efficiently move sites to closure
An updated version of the ASTM Guide for Calculating LNAPL Transmissivity is Now Available for Purchase at www.astm.org.
ASTM Standard E2856 – Standard guide for Estimation of LNAPL Transmissivity is now available
The ASTM LNAPL Conceptual Site Model (LCSM) workgroup is actively updating the ASTM LCSM guidance document. If you are interested in participating on this team or would like to send comments for consideration – please contact Andrew Kirkman of BP Americas (team leader).
ANSR now has a companion group on LinkedIn that is open to all and is intended to provide a forum for the exchange of questions and information about NAPL science. You are all invited to join by clicking here OR search for “ANSR – Applied NAPL Science Review” on LinkedIn.
If you have a question or want to share information on applied NAPL science, then the ANSR LinkedIn group is an excellent forum to reach out to others internationally.