Applied NAPL Science Review (ANSR)
Demystifying NAPL Science for the Remediation Manager
Review Board:
J. Michael Hawthorne, PG, Board of Chairman, GEI Consultants, Inc.
Mark Adamski, PG, BP America
Dr. Randall Charbeneau, University of Texas
Dr. Sanjay Garg, Shell Global Solutions (US) Inc.
Dr. Terrence Johnson, United States Environmental Protection Agency
Andrew Kirkman, PE, AECOM
Mark Malander, ExxonMobil Environmental Services
LNAPL Transmissivity
Andrew Kirkman, PE – AECOM
LNAPL transmissivity incorporates NAPL physical properties, saturation and relative permeability as well as aquifer parameters, and correlates well with LNAPL recoverability. It provides a recoverability metric that is comparable between sites regardless of geology or product type. It is a substantially improved metric over apparent NAPL thickness gauged in wells.
BACKGROUND: Apparent NAPL Thickness (ANT) gauged in wells has a long history of misapplication as a metric for recoverability of Light Non-Aqueous Phase Liquid (LNAPL). For example, the same ANT can exhibit substantially different recoverable NAPL volumes in different soils with different grain-size distributions. Consequently, ANT is a poor metric for LNAPL recoverability. LNAPL transmissivity, on the other hand, is a summary metric that incorporates NAPL physical properties, saturation, and relative permeability as well as aquifer parameters, and as a result correlates very well with LNAPL recoverability.
Think of it this way – an aquifer’s water production capability is not determined by measuring the height of the water column in a well, but rather by performing an aquifer test to measure hydraulic conductivity and transmissivity. These values are then used to calculate the “recoverability” (sustainable pumping rate and other factors) for groundwater from the tested well/aquifer. Logically then, the recoverability of LNAPL should not be based on measured thickness in a well, but instead on LNAPL transmissivity, which is based on the same defining equations as water transmissivity.
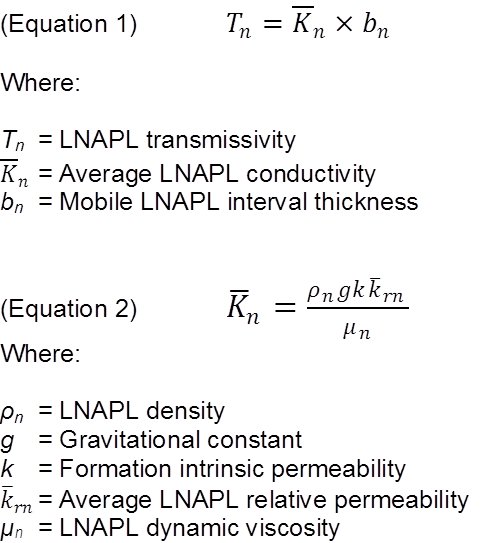
Cross-sectional diagram showing the relationship between LNAPL transmissivity and LNAPL conductivity values over the height of the mobile LNAPL interval.
Definition: LNAPL transmissivity (Tn) is defined as “the quantity of LNAPL that will flow through a unit aquifer width in a unit time for a unit gradient” and accounts for the entire vertical interval of LNAPL flow. LNAPL transmissivity can be thought of as a “how much, how fast” measure of LNAPL recoverability.
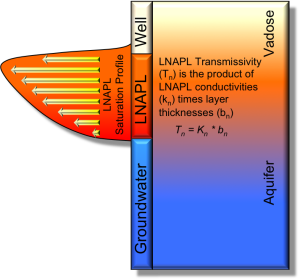
Three dimensional diagram of aquifer (groundwater) transmissivity versus LNAPL transmissivity. T = aquifer transmissivity, bn = mobile LNAPL interval thickness, Tn = LNAPL transmissivity, Kn = average LNAPL conductivity.
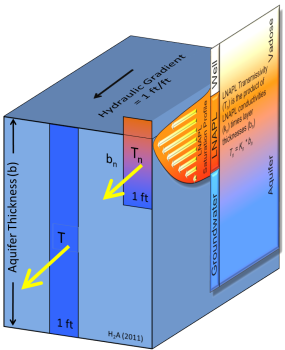
METHODS: Multiple methods to measure LNAPL transmissivity exist, including:
- LNAPL baildown or slug testing
- Recovery data analysis (short or long term)
- LNAPL only (skimming)
- Vacuum-enhanced LNAPL only (vacuum-enhanced skimming)
- LNAPL and water (total fluids pumping)
- Vacuum-enhanced LNAPL and water (multi-phase extraction)
- Tracer testing
Descriptions of each method are beyond the scope of this article, but will be addressed in forthcoming guidance from ASTM and future issues of ANSR. The selection of method carries implications for the scale of measurement over space and time (e.g., single well versus area values, point in time versus average values over time). Reliable LNAPL transmissivity values can only be calculated based on a sound LNAPL conceptual site model that includes an understanding of LNAPL hydrogeologic conditions (unconfined, confined, or perched LNAPL or combinations over time).
Spatial and temporal scale relationships among the various LNAPL transmissivity estimation methods. VES = vacuum-enhanced skimming, MPE = multi-phase extraction.
APPLICATION: Once LNAPL transmissivity values have been calculated, they may be utilized in a variety of ways, including:
- LNAPL transmissivity mapping to identify zones or trends of recoverability
- Leading (startup) parameter for initiation of hydraulic LNAPL recovery
- Lagging (shutdown) parameter for cessation of hydraulic LNAPL recovery
- Robust multi-phase model calibration parameter
As of this date, a range of values for LNAPL transmissivity as a leading/lagging hydraulic recovery metric, rather than a single threshold value, has typically been utilized in order to accommodate normal measurement error and naturally occurring heterogeneities that influence reproducibility of calculated LNAPL transmissivity values. While some debate exists, a commonly utilized range for leading/lagging LNAPL transmissivity threshold values is 0.1 to 0.8 ft2/day (ITRC, 2009). This hydraulic LNAPL recoverability threshold has no application to risk-based criteria for site closure (e.g., dissolved and/or vapor phase issues).
SUMMARY: LNAPL transmissivity (Tn) is a universal metric for LNAPL recoverability that is based on the same equation as water transmissivity (the industry standard metric for water production), and represents an improved metric for recoverability of LNAPL over apparent NAPL thickness (ANT). ANT can be strongly exaggerated by confined or perched hydrogeologic conditions and varying soil types and does not generally correlate well with LNAPL recoverability. Multiple measurement methods for LNAPL transmissivity exist, including baildown or slug testing, recovery data analysis, and tracer testing. Each method provides a different scale of measurement in space and time, with method selection dependent upon site parameters and the potential use for the measured values. LNAPL transmissivity may be used as a spatial indicator for recoverability (mapping), a leading/lagging threshold metric for hydraulic LNAPL recovery (threshold range of 0.1 to 0.8 ft2/day), and as a robust model calibration parameter for multi-phase models.
REAL WORLD LIMITATIONS: A word of caution – a detailed understanding of LNAPL hydrogeology (e.g., Is the LNAPL unconfined, confined, or perched) is required in order to correctly calculate drawdown and/or the mobile LNAPL interval thickness, which are required to accurately calculate LNAPL transmissivity. Complex mobile LNAPL intervals (e.g., interbeded intervals) can be difficult to interpret and analyze. As always, multiple lines of evidence should be used.
REFERENCE: ITRC (2009), Evaluating LNAPL Remedial Technologies for Achieving Project Goals, Technical/Regulatory Guidance LNAPL-2, The Interstate Technology & Regulatory Council.