Applied NAPL Science Review
Demystifying NAPL Science for the Remediation Manager
ANSR Scientific Review Board
J. Michael Hawthorne, PG, Board of Chairman, GEI Consultants Inc.
Mark Adamski, PG, BP Americas
Dr. Randall Charbeneau, University of Texas
Dr. Sanjay Garg, Shell Global Solutions (US) Inc.
Dr. Terrence Johnson, USEPA
Andrew J. Kirkman, PE, AECOM
Mark Lyverse, PG, Chevron Energy Technology Company
Mark W. Malander, ExxonMobil Environmental Services
Applied NAPL Science Review (ANSR) is a scientific ejournal that provides insight into the science behind the characterization and remediation of Non-Aqueous Phase Liquids (NAPLs) using plain English. We welcome feedback, suggestions for future topics, questions, and recommended links to NAPL resources. All submittals should be sent to the editor.
Laser-Induced Fluorescence Primer II:
Interpreting Waveforms
Dakota Technologies, Inc.
Ultraviolet (UV) laser-induced fluorescence (LIF) screening tools cause fluorescence in light non-aqueous phase liquids (LNAPLs). Total fluorescence readings estimate the quantity of LNAPL present, but LIF can also capture fluorescence “waveforms” to qualitatively evaluate LNAPL type.
[This article focuses on UV LIF’s application to petroleum fuels and oils, but NOT creosotes and coal tar which require the Tar-specific Green Optical Screening Tool or TarGOST. TarGOST and heavier hydrocarbons will be discussed in a forthcoming issue of ANSR.]
BACKGROUND:
Optical screening tools (OSTs) can “flash” a sample for a few nanoseconds then read the fluorescence that continues long after the flash has stopped. This fluorescence “lifetime” varies from well under a nanosecond to tens or even hundreds of nanoseconds.
OSTs have time-resolved LIF built in to simultaneously record the “color” (spectral nature) and lifetime (temporal nature) of the fluorescence. OST LIF systems can tentatively identify the type of petroleum, discern false positives, and detect weathering of certain LNAPLs.
MULTI-WAVELENGTH WAVEFORMS:
The left side of Figure A illustrates the combined spectral/temporal nature of the fluorescence emitted by the polycyclic aromatic hydrocarbons (PAHs) in diesel, and the right side shows the 2D “shorthand” style waveform.
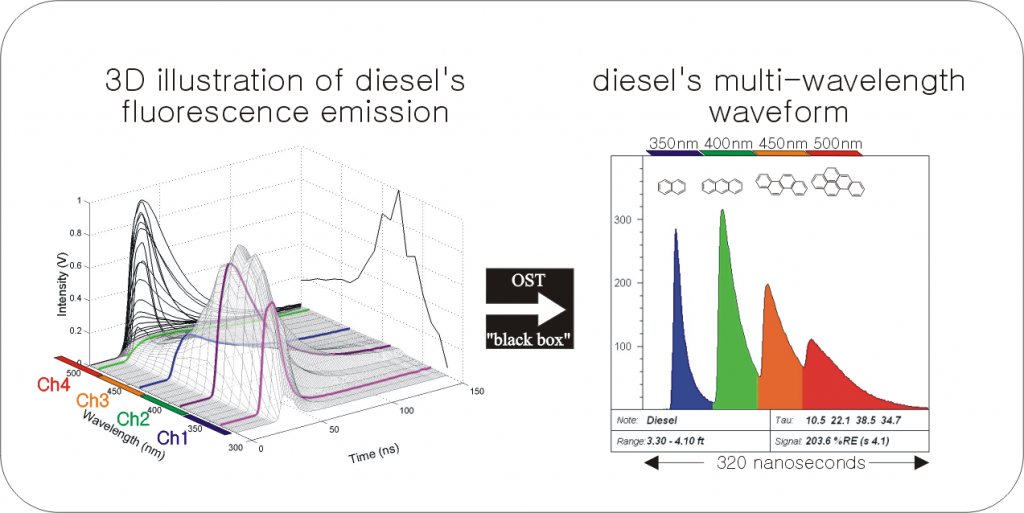
Key characteristics of waveforms include:
Intensity (Amount of Fluorescence)
The y-axis represents the intensity or “brightness” of the fluorescence.
- Intensity generally increases with increasing fuel/oil pore saturation.
- The relative fluorescence intensity is dependent on the composition of the fuel
- Some fuels (diesel and crude) fluoresce more intensely than others (gasoline).
- Low viscosity fuels/oils usually fluoresce better than high viscosity fuels/oils.
The Four Fluorescence Channels (“Peaks”)
The x-axis of Figure A represents 320 nanoseconds of time during which the four wavelengths of fluorescence arrive at the detector at sequentially delayed times.
- The four channels fluoresce at approximately 350 (blue), 400 (green), 450 (orange), and 500 (red) nanometers (nm).
- The relative intensities of the four color channels fill the LIF log with blended color to visualize fluorescence trends “at a glance” [note the fill-color boxes in the upper right corner of the example waveforms below].
- OST systems are calibrated to a Reference Emitter (RE) fluid, similar to calibrating a PID to a reference gas. The RE fluid is a standard fluorescing NAPL supplied by Dakota Technologies, Inc. to all OST service providers, and the mixture has been consistent for 15 years.
- The purpose of the RE fluid is to:
- Normalize the data for ”hole-to-hole” fluctuations.
- Check the system to ensure all optics are intact and functioning normally.
- All downhole data is normalized to the RE (as a percentage) so that data is consistent across all OSTs across the globe regardless of who is operating them.
- The area under the curve of the four channels is summed and divided by the RE waveforms’ areas to generate the normalized total fluorescence “Signal” of an LIF log.
- One PAH will usually occupy more than one channel since PAHs fluoresce broadly (naphthalene is an exception, fluorescing almost exclusively in the blue channel).
- In general, the shorter wavelength channels (blue/green) are occupied by 2- and 3-ring PAHs, the middle (green/orange) by 3- and 4-ring PAHs, and the rightmost (orange/red) by 4-ring and larger PAHs [Figure A].
Lifetimes (Decaying Fluorescence)
The x-axis covers an extremely short time period to capture the short PAH fluorescence – lifetime is the average time the PAH population stays in the excited state.
- PAHs fluoresce from a few to hundreds of nanoseconds.
- In the characteristic diesel example, the blue channel has a shorter lifetime (right side intensity falls back toward baseline quickly) than the green channel.
- The lifetimes of some channels “bleed” into subsequent channels (green into orange) and influence the colorization.
- Short lifetimes often indicate an energy transfer from the excited PAHs to surrounding, larger PAHs or matrix. This leads to quenching of fluorescence and red-shifting of the emission toward the right.
- Long lifetimes often indicate oxygen starvation and/or a solvent-rich fluorescent friendly environment. Natural gas condensates can have unusually long lifetimes.
EXAMPLE WAVEFORMS:
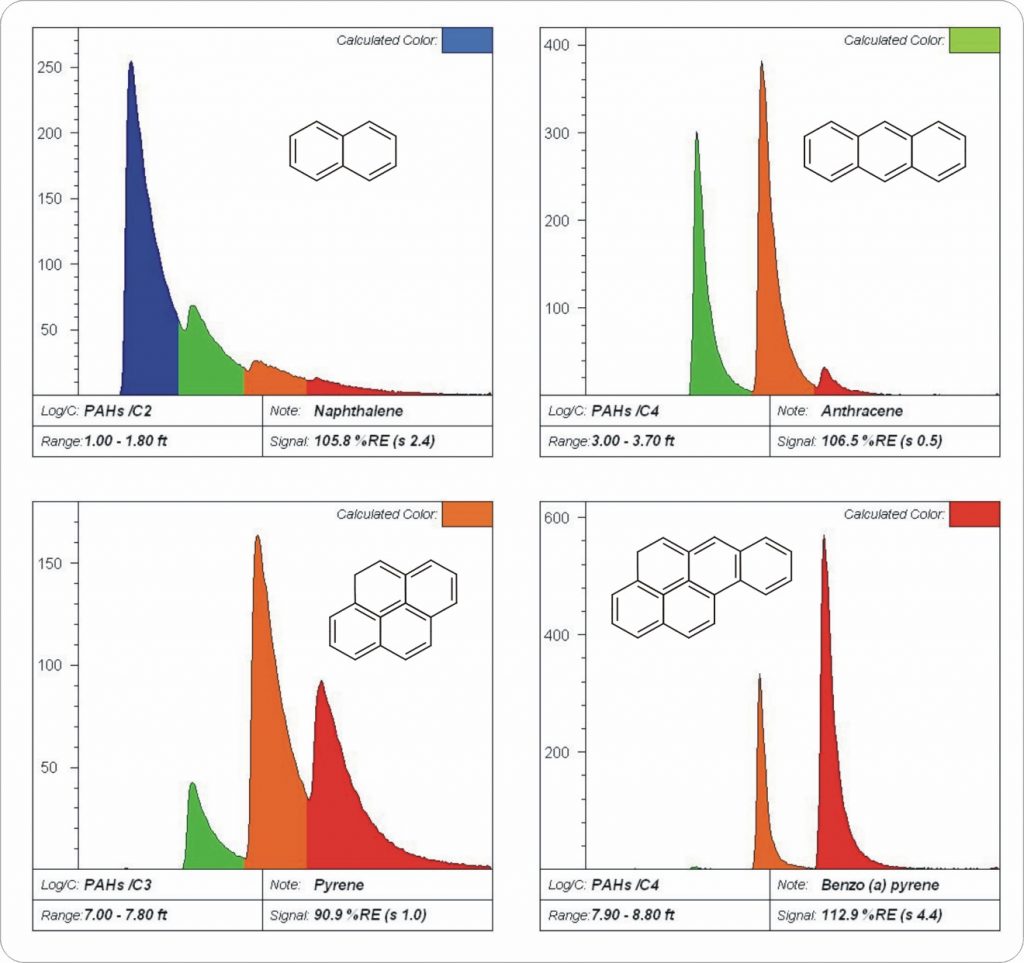
PAHs:
PAH logs show the general trend of emission with size/complexity of PAHs (Figure B).
- The upper-left is Naphthalene, fluorescing almost entirely in the blue channel.
- The upper-right is Anthracene, the simple addition of one more benzene ring shifted the fluorescence by about 75-100 nm (about 1.5-2 “channels”).
- The lower-left is Pyrene, which is one ring larger but more “compact” so the red-shifting is moderate.
- The lower-right is Benzo (a) pyrene, emitting almost entirely in the red channel.
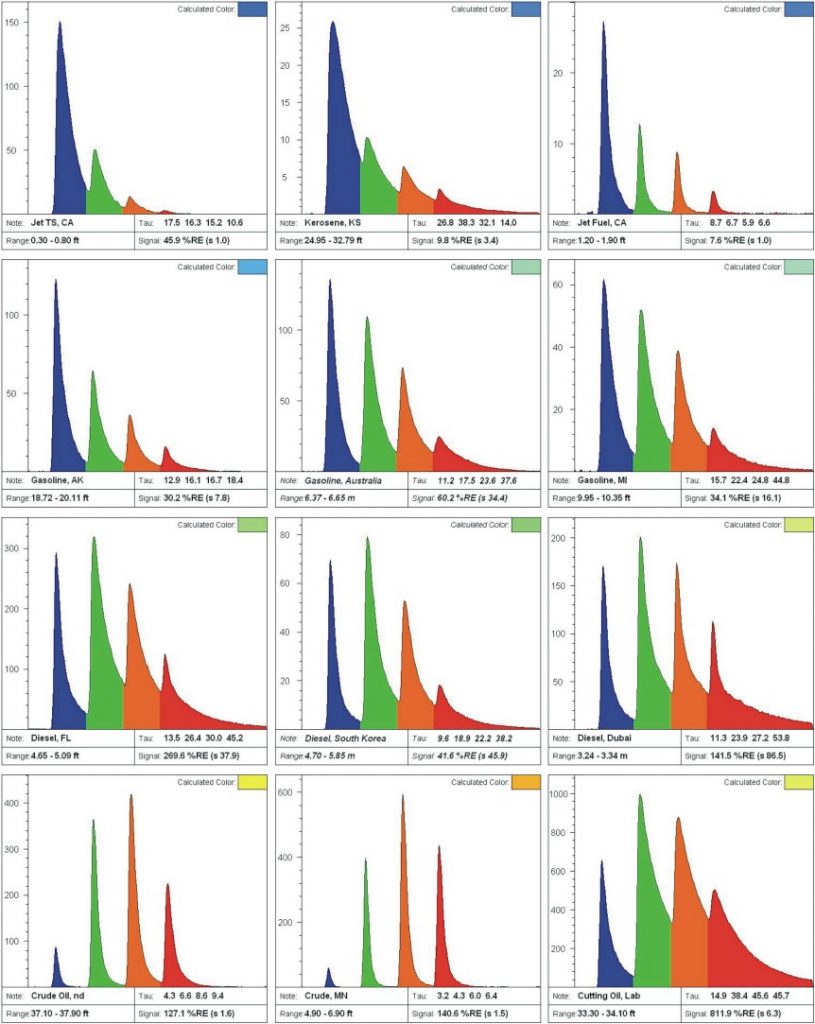
Fuels/Oils:
Fuels/oils contain complex chemical populations with broad forms. The “EPA 16” PAHs only account for approximately 1 percent of the PAHs in crude oil, so there are usually plenty of PAHs to fluoresce. From “blue to red” some common fuel/oil waveforms, shown in Figure C, include the following:
- Jet/Kerosene [Row 1]:
- Naphthalene and Jet/Kerosene waveforms are similar and both are almost exclusively dominated by naphthalenes.
- Gasoline [Row 2]:
- Intact (unweathered) gasoline has the typical shape shown and will fluoresce well enough to be delineated with LIF even though gasoline contains only small concentrations of 2- to 3-ring PAHs relative to the benzene, toluene, ethylebenzene and xylenes (BTEX) and aliphatics.
- Diesel [Row 3]:
- Diesel has a short lifetime blue (2-ring) peak that is about the same height as the longer lifetime green peak. Evidence of weathering in diesels is rare.
- Oils [Row 4]:
- Oils such as crude, lubricating, and cutting types fluoresce well and are usually found slightly right of center (red-shifted) and have medium to long lifetimes.
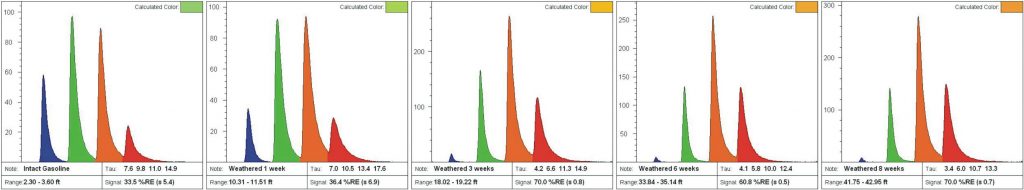
Weathering:
Weathering typically removes the most soluble, volatile, and metabolized PAHs first. Large PAHs remain, which causes a red-shift in the waveform. Simultaneously there is a loss of solvent aliphatics, which usually shortens the lifetime so a weathered light fuel will start to look like oil or even tar. Figure D demonstrates weathering of gasoline in a lab experiment resulting in red-shifting that can make weathered gasoline appear to be “oil”. When jet/kerosene weather they “disappear” (become non-fluorescent) because there are no larger PAHs to continue fluorescing once the naphthalenes are gone.
NAPLs (especially gasolines) can vary substantially in their appearance. The degree of red-shifting is relative to the starting product and site conditions. For instance, one site’s intact (unweathered) gasoline waveform might very well be identical to a different site’s moderately weathered gasoline.
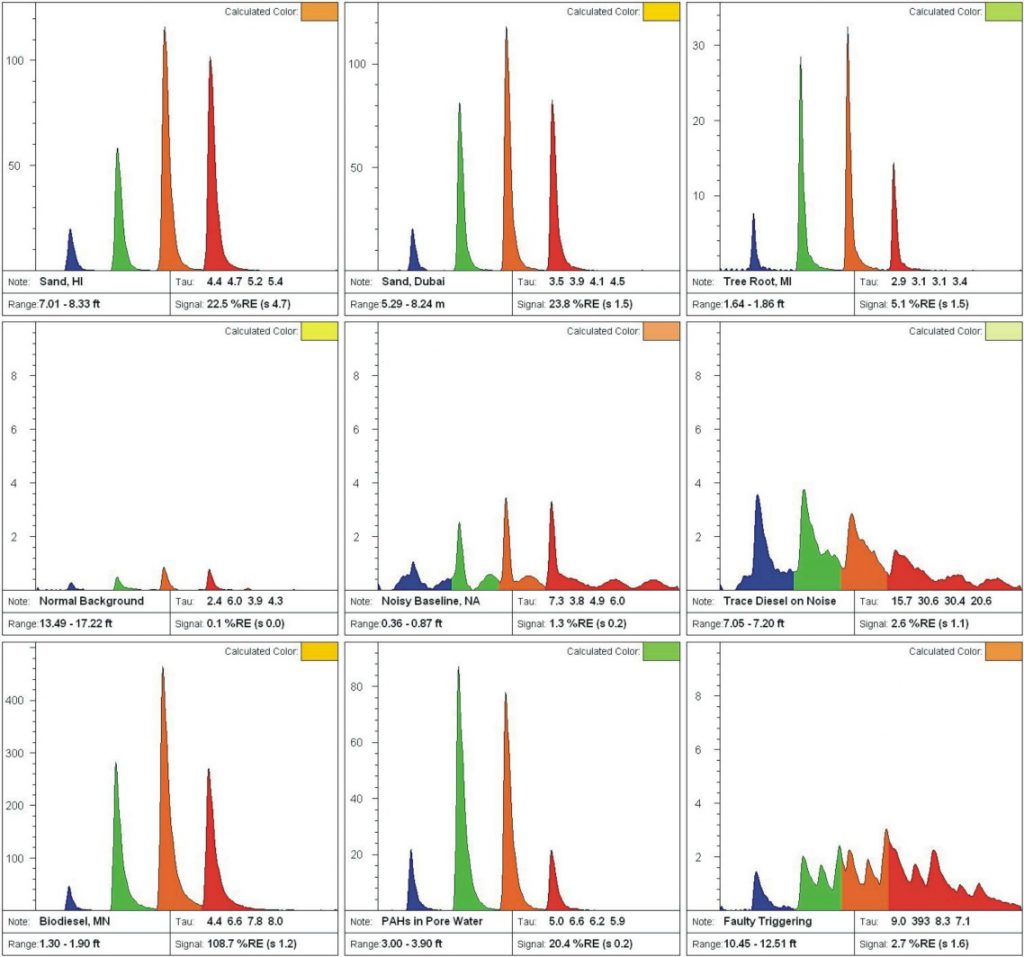
False Positives and Oddities:
Areas with little to no contamination may still show false or misleading signals. Figure E contains a variety of noise, false-positives, or highly unusual waveforms. Be prepared to obtain samples in order to figure out what materials are causing any odd fluorescence waveforms.
Real World Limitations: Identification of specific LNAPL types via Laser-Induced Fluorescence is an estimation that can be very useful as part of an LNAPL Conceptual Site Model, but should not be relied upon solely for LNAPL fingerprint identification.
Related Links
API LNAPL Resources
ASTM LCSM Guide
Env Canada Oil Properties DB
EPA NAPL Guidance
ITRC LNAPL Resources
ITRC LNAPL Training
ITRC DNAPL Documents
RTDF NAPL Training
RTDF NAPL Publications
USGS LNAPL Facts
ANSR Archives
Coming Up
Look for more articles on LNAPL transmissivity as well as additional explanations of laser induced fluorescence, natural source zone depletion and LNAPL Distribution and Recovery Modeling in coming newsletters.
Announcements
An updated version of the ASTM Guide for Calculating LNAPL Transmissivity is Now Available for Purchase at www.astm.org.
ASTM Standard E2856 – Standard guide for Estimation of LNAPL Transmissivity is now available
The ASTM LNAPL Conceptual Site Model (LCSM) workgroup is actively updating the ASTM LCSM guidance document. If you are interested in participating on this team or would like to send comments for consideration – please contact Andrew Kirkman of BP Americas (team leader).
ANSR now has a companion group on LinkedIn that is open to all and is intended to provide a forum for the exchange of questions and information about NAPL science. You are all invited to join by clicking here OR search for “ANSR – Applied NAPL Science Review” on LinkedIn. If you have a question or want to share information on applied NAPL science, then the ANSR LinkedIn group is an excellent forum to reach out to others internationally.