Applied NAPL Science Review
Demystifying NAPL Science for the Remediation Manager
ANSR Scientific Review Board
J. Michael Hawthorne, PG, Board of Chairman, GEI Consultants Inc.
Mark Adamski, PG, BP Americas
Dr. Randall Charbeneau, University of Texas
Dr. Sanjay Garg, Shell Global Solutions (US) Inc.
Dr. Terrence Johnson, USEPA
Andrew J. Kirkman, PE, AECOM
Mark W. Malander, ExxonMobil Environmental Services
Applied NAPL Science Review (ANSR) is a scientific ejournal that provides insight into the science behind the characterization and remediation of Non-Aqueous Phase Liquids (NAPLs) using plain English. We welcome feedback, suggestions for future topics, questions, and recommended links to NAPL resources. All submittals should be sent to the editor.
Laser-Induced Fluorescence (LIF) Primer
Randy St. Germain (Dakota Technologies, Inc.)
Editors Note: Randy St. Germain is one of the world’s leading scientists in the development and application of laser-induced fluorescence tools for the investigation of non-aqueous phase liquids (NAPLs). This article is an excerpt summary of a longer article available at www.NAPL-ANSR.com, and focuses on ultraviolet (UV) LIF’s application to petroleum fuels/oils, not creosotes and coal tars, which are better characterized using visible wavelength LIF.
Laser-induced fluorescence (LIF) employs laser light to excite fluorescent molecules contained in the majority of non-aqueous phase liquids (NAPLs) including petroleum fuels/oils, coal tars, and creosotes. Direct push logging of the NAPL’s inherent fluorescence with depth provides rapid and cost-effective delineation of NAPL. Multiple LIF logs conducted at NAPL release sites provide a basis for a detailed NAPL conceptual site model.
BACKGROUND: Laser light is “clean” (narrow in wavelength) and readily transmitted with fiber optics, allowing scientists to deliver laser light remotely to samples and bring back for analysis any resulting light. Polycyclic aromatic hydrocarbons (PAHs) are highly fluorescent, but to coax them into fluorescing you must energize PAHs into an excited state by shining the correct color of light at them. They will absorb that light and, in a matter of nanoseconds, emit some light of their own to get rid of the excess energy gained. The color of the emitted light is dependent on the number of rings and degree of substitution of the PAH that emits the fluorescence.
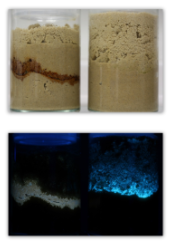 Petroleum NAPLs usually contain enough PAHs to be detected with LIF. Two NAPL’s with differing PAH distribution/content will fluoresce different colors (see photos). Notice that the “core” of the NAPL is brightest and the edges get fainter. This is because fluorescence for a single NAPL in a single soil type typically scales directly with the amount of NAPL in the pore spaces. While the photographs can’t capture lifetime information, the PAHs in the crude oil and the diesel are emitting varying colors of light over varying periods of time, allowing further differentiation by LIF systems that are designed to log both the spectral and temporal nature of the emitted light.
Photographs of crude oil (left) and diesel fuel (right) on water-saturated sand under room light (top) and long wavelength ultraviolet lamp excitation (bottom).
BASIC METHOD: Commercially available LIF screening tools transmit pulses of laser light down fiber optic cables in push probe rods (advanced through the soil column steadily at ~2cm/second) and out through a clear sapphire window fitted into the side of the probe (see illustration below). The light pulses exit the window and shine onto the face of the passing soil without penetrating into the formation. Any resulting fluorescence and/or scattered laser light that comes back into the window is brought uphole by a second fiber, where the light is processed and analyzed in real time.
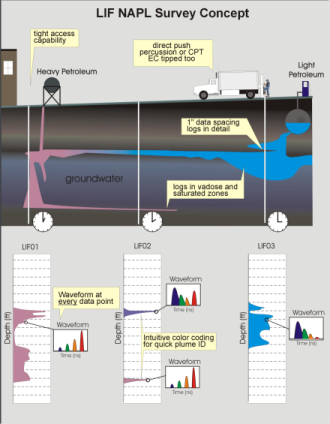
Concept diagram of NAPL site investigation with LIF. Direct push logging generates 300-400 ft of detailed information daily, spread across 8-14 locations, allowing for rapid assessment of the nature and extent of NAPL.
LIF systems log up to 100 ft below the surface with an “average” LIF log being about 35 ft and taking approximately 45 minutes start to finish. The logs indicate in real time exactly where NAPL fluorescence is occurring, with major differences in the fluorescence color and lifetime due to differing NAPL types, weathering, or false positives. The goal is to quickly survey the subsurface to generate an electronic data set to develop a NAPL conceptual site model (CSM).
BASIC LIF INTERPRETATION: The simulated logging scenario in the illustration below contains many situations encountered during a typical LIF investigation. Four distinct mobile NAPL intervals in the vadose and saturated zones (far left saturation curves) and a layer of NAPL-free shell hash occur within two primary soil types: 1) coarse high permeability soils (sands/gravel) and 2) fine grain low-permeability soils (silts/clays). Notice the LIF probe traveling down through the soil column in the diagram’s center. On the right is the resulting LIF log that would be generated in real time as the LIF probe is pushed/pounded steadily through the soil column.
The LIF log y-axis is depth below ground surface, while the x-axis is fluorescence intensity or Signal %RE. The fluorescence signal typically scales directly with NAPL pore saturation. The RE stands for Reference Emitter, which is a cuvette filled with a stable fluorescent NAPL that is placed on the sapphire window and recorded prior to each and every LIF log, and which normalizes the LIF response similar to using a tank of 100 ppm isobutylene to normalize the response on a handheld PID.
The RE-labeled callout (waveform) at the upper right side of the figure is not attached to any depth of the log, because it wasn’t acquired at depth, but right before logging began. These callout waveforms are a rather complicated hybrid of both spectral (color) and temporal (lifetime) fluorescence information. For UV LIF, waveforms from fuels dominated by 2-ring PAHs (like naphthalenes in kerosene) are heavily weighted toward the first (blue) channel. Diesel has a broad distribution of 2, 3, and 4 ring PAHs, so it’s lit up across all channels (blue, green, orange, and red). Bunker fuel’s fluorescence is dominated by the larger 4 and 5 rings, so its fluorescence waveform is right-weighted (high in the orange and red channels). A library of waveform types has been developed for a wide variety of other NAPLs.
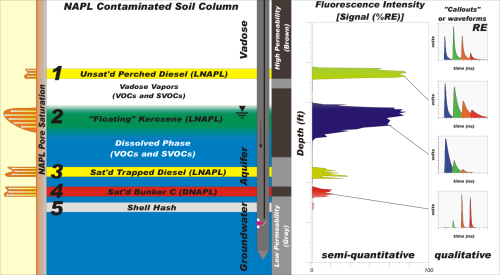
Cross-sectional diagram showing the relationship between NAPL type, matrix, and saturation of pore spaces with NAPL vs LIF data. See Applied NAPL Science Review for a detailed description of this figure.
KEY ELEMENTS OF LIF:
- LIF detects the PAHs in NAPL and logs NAPL versus depth
- LIF is compatible with both cone penetration test (CPT) and percussion based direct push drilling technologies
- LIF is a mature technology, with hundreds of miles of LIF logging at hundreds of sites in the last 20 years
- LIF is logged continuously with depth (2cm/second) – no data gaps or partial recovery
- Typical LIF production is 300-400 ft/day – spread across 8-14 locations
- LIF detects NAPL equally well in both the vadose and saturated zones
- LIF’s potential false positives include shell hash, meadow mat, peat, wood, and calcareous sands
- Waveforms (and color-fill logs derived from waveforms) help to differentiate between NAPL types and to identify false positives
- LIF does not detect chlorinated solvent DNAPL unless it contains fluorophores (degreasers, industrial waste, etc.)
- UV LIF should NEVER be used to delineate coal tars and creosotes, use visible LIF instead
While LIF does have limitations that need to be understood and managed, it is a very rapid and thorough method of determining nature and extent of petroleum NAPL. LIF surveys can substantially improve conceptual site models, thereby leading to a better understanding of NAPL risks and a better design of NAPL controls and/or remediation systems.
Real World Limitations: A word of caution – Laser-induced fluorescence does not detect all NAPLs under all geologic or hydrogeologic scenarios. Where applicable, LIF can be a powerful tool to better understand the distribution of NAPL in the subsurface. But LIF should not be blindly applied at every NAPL site without consideration by and oversight from applicable chemical, geological and other experts with experience in the application and interpretation of LIF.