Applied NAPL Science Review (ANSR)
Demystifying NAPL Science for the Remediation Manager
Review Board:
J. Michael Hawthorne, PG, Board of Chairman, GEI Consultants, Inc.
Mark Adamski, PG, BP America
Dr. Randall Charbeneau, University of Texas
Dr. Sanjay Garg, Shell Global Solutions
Dr. Terrence Johnson, United States Environmental Protection Agency
Hydrostratigraphs
Flexible CSM Visualization Tools
GEI Consultants, Inc.
How can we best visualize complex time-sequential, numeric, single-point conceptual site model (CSM) data? The answer is to take the classic hydrograph and turbo-charge it with stratigraphic and other data to create Hydrostratigraphs.
BACKGROUND: In the preceding issues of ANSR we discussed Light Non-Aqueous Phase Liquid (LNAPL) thickness and Diagnostic Gauge Plots as Conceptual Site Model (CSM) tools. One simple yet powerful vehicle to place these tools in context for a site is the Hydrostratigraph. Hydrostratigraph is a term first coined by the author in 2005 to describe diagrams created by combining hydrograph elevations over time with stratigraphic contact elevations to graphically depict and evaluate the distribution and mobility of LNAPL over vertically varying piezometric conditions.
DEFINITION: Three data sets define basic Hydrostratigraphs:
- Elevation vs. Time: Elevation-related data such as LNAPL hydrograph and well screen elevations are graphed on the primary horizontal (time) and primary vertical (elevation) axes regardless of whether that data is static or dynamic over time.
- Thickness vs. Time: With the addition of a second vertical axis, apparent LNAPL thickness (ANT) at a vertical scale sufficient to identify trends over time is plotted on the primary horizontal time axis.
- Stratigraphy vs. Elevation: Lithologic contacts are plotted on the primary horizontal (time) and vertical (elevation) axes.
In addition, advanced Hydrostratigraphs may be constructed by adding a second horizontal axis (any data type or scale) that may be matched to the primary or secondary vertical axis. Advanced Hydrostratigraphs incorporate a broad range of data such as laser induced fluorescence (LIF), hydrocarbon production, or cone penetration testing (CPT) soil behavior type (SBT) data.
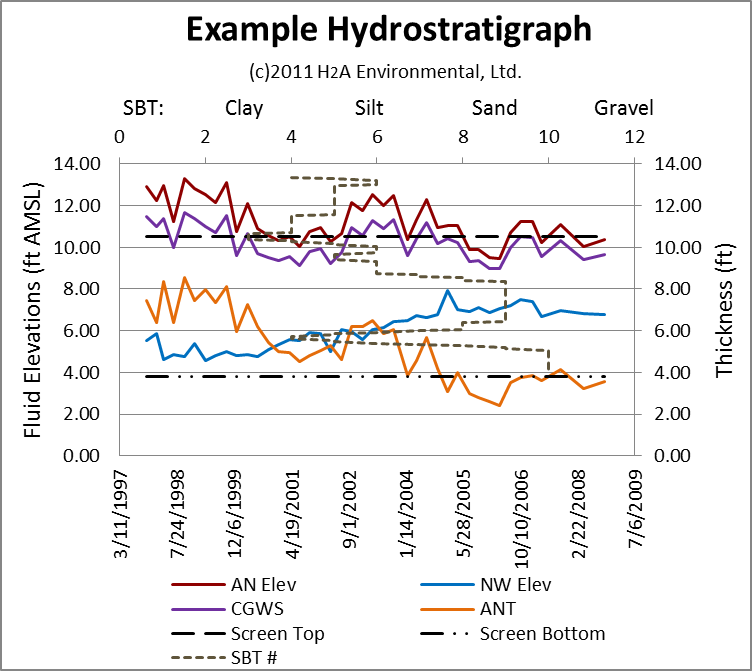
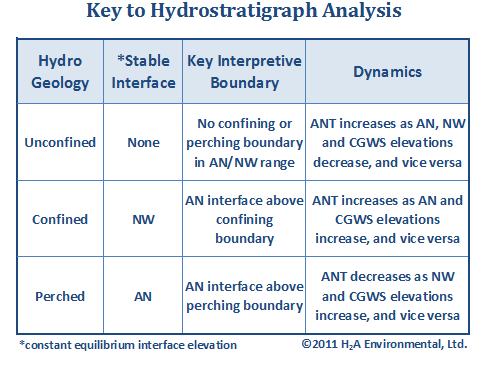
INTERPRETATION: Basic Hydrostratigraphs incorporate Air/NAPL (AN), NAPL/Water (NW), Corrected Ground Water Surface (CGWS) and stratigraphic contact (e.g., confining layer) elevations as well as apparent NAPL thickness (ANT) trends. These trends can be useful in identifying periods of unconfined, confined or perched LNAPL. The ANT for unconfined LNAPL will approximate the formation NAPL thickness (FNT). The FNT for confined or perched LNAPL may be estimated based on the difference between the key stable interface (see Table) and the respective confining or perching layer elevations.
Advanced Hydrostratigraphs (e.g., production Hydrostratigraphs, CPT Hydrostratigraphs, LIF Hydrostratigraphs) provide a vehicle to visualize and interpret microstratigraphic impacts on LNAPL distribution and recoverability.
SUMMARY: Hydrostratigraphs are a blend of hydrographs and stratigraphic cross-sections, making them ideal time-sequential single-point conceptual site model (CSM) visualization and analysis tools. Hydrostratigraphs and Diagnostic Gauge Plots (ANSR v1i2)
REAL WORLD LIMITATIONS: A word of caution – vertical gradients, non-equilibrium conditions, and other factors can affect the results of a Hydrostratigraph analysis. For example, confined or perching conditions may exist as a result of relatively minor grain size variation and the resulting capillary contrast rather than the presence of a sharp stratigraphic contact. Of particular concern, true equilibrium conditions may only rarely, if ever, be attained at a site. Complex stratigraphic sequences across screened intervals can mask ideal trends. Multiple lines of evidence should be used.
Next month we will explore drawdown versus discharge (DvD) plots as tools to identify confined and perched NAPL. DvDs are useful NAPL Conceptual Site Model (CSM) tools to augment Diagnostic Gauge Plot and Hydrostratigraph analyses.
Until then, feel free to call or email us with any questions about how Hydrostratigraphs can be used in modern day NAPL science to minimize your site remediation costs.
Disclaimer: The views and opinions expressed in the article are solely the views of the Author(s). Every effort has been made to ensure the accuracy of all the information contained in this article. However, no representations or warranties whatsoever are made as to the accuracy, completeness or suitability for any purpose of the article content.