Applied NAPL Science Review
Demystifying NAPL Science for the Remediation Manager
Editor: J. Michael Hawthorne, PG
Asst. Editor: Dr. Rangaramanujam Muthu
ANSR Scientific Advisory Board
J. Michael Hawthorne, PG, Board of Chairman, GEI Consultants Inc.
Mark Adamski, PG, BP Americas
Stephen S. Boynton, PE, LSP, Subsurface Env. Solutions, LLC
Dr. Randall Charbeneau, University of Texas
Paul Cho, PG, CA Regional Water Quality Control Board-LA
Robert Frank, RG, CH2M Hill
Dr. Sanjay Garg, Shell Global Solutions (US) Inc.
Randy St. Germain, Dakota Technologies, Inc.
Dr. Dennis Helsel, Practical Stats
Dr. Terrence Johnson, USEPA
Andrew J. Kirkman, PE, BP Americas
Mark Lyverse, PG, Chevron Energy Technology Company
Mark W. Malander, ExxonMobil Environmental Services
Editor’s Note: With this issue we are beginning a new research corner where we will report a selected abstract and provide a link to the accompanying report from academic research. We are grateful to Dr. Tom Sale of the Colorado State University, Center for Contaminant Hydrology, for providing access to selected graduate level NAPL research.
Applied NAPL Science Review (ANSR) is a scientific ejournal that provides insight into the science behind the characterization and remediation of Non-Aqueous Phase Liquids (NAPLs) using plain English. We welcome feedback, suggestions for future topics, questions, and recommended links to NAPL resources. All submittals should be sent to the editor.
Filtering Baildown Test Data
GEI Consultants, Inc.
Editor’s note: We would like to thank Briana Jasinski of Environmental Consulting & Technology, Inc. for providing the dataset used in this article.
Baildown testing consists of the removal of non-aqueous phase liquid (NAPL) from a well followed by gauging of NAPL recharge into the well from which light non-aqueous phase liquid (LNAPL) transmissivity may be calculated. A number of problems can occur during such tests, including
- Gauging data may be collected more frequently than NAPL recharge occurs, which can result in zero changes in drawdown and apparent NAPL thickness (ANT), which in turn can cause errors in subsequent LNAPL transmissivity calculations; and
- Data collected may be scattered on analysis plots and difficult to interpret in terms of filter pack recharge or attainment of equilibrium recovery conditions.
These issues arise because routine gauging errors are large relative to small changes in the air/NAPL and NAPL/water interfaces. Gauging errors may occur due to
- Normal limits of human precision and accuracy when obtaining field measurements using field devices;
- Problems with the electronic interface probe (EIP) or other gauging device used (e.g., kinked, twisted, or crimped cable that does not provide repeatable measurements); and
- A NAPL/water interface that is not clearly measurable (e.g., emulsification at the interface).
Typically, gauging errors show up as noisy data on the discharge versus drawdown (DvD) graphs or as negative discharge and/or drawdown values at various points within the test data. One solution that will often correct these issues is to filter the data to reveal clean DvD trends.
The objective of data filtration is to standardize the magnitude of change in NAPL thickness from data point to data point in accordance with gauging frequency guidelines presented in ASTM E2856-13 (2013). This results in equal weighting of all portions of the test.
As a practical matter, initial gauging measurements are often collected roughly every minute during the initial part of a baildown test until recharge has slowed sufficiently to allow time to forecast subsequent required gauging intervals. ASTM recommends collecting measurements every 0.05 to 0.1 foot of ANT change (ASTM, 2013 Section 6.4). This ASTM gauging frequency guidance can also be applied to subsequent filtering of data that may have been collected in the field at a frequency higher than the ASTM guidelines.
Let’s assume that for a given baildown test, gauging measurements were collected every minute for the first 10 minutes of recharge from a well with an initial thickness of 0.5 foot of ANT, and during that first 10 minutes the ANT recharged to 0.1 foot. As a result, we now have ten data points for 0.1 foot of ANT, roughly equivalent to one point for every 0.01 foot of ANT recharge (Figure 1). An absolute gauging accuracy of 0.01 foot during rapidly acquired recharge data for two different interfaces is highly unlikely, and so this data almost certainly includes error (high frequency / low accuracy data).
Based on ASTM guidance, a maximum of eight additional data points would be collected over the remainder of the recharge (Figure 1). This would result in poor weighting of the various portions of the test with 56 percent of the data points representing only 20 percent of the test. In addition, the high frequency / low accuracy early time data would almost certainly include scatter effects (noise).
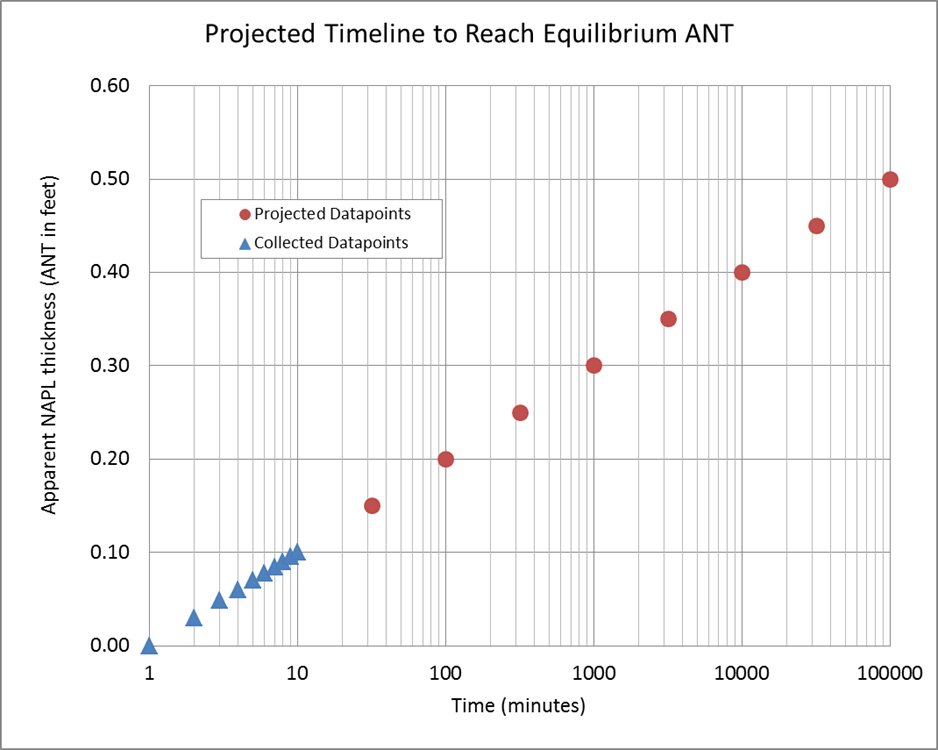
Figure 1. Semi-logarithmic plot of elapsed time in minutes (log scale) versus ANT (ANT – linear scale) in the well in feet showing the first 10 minutes of measured ANT recharge data as well as the remaining projected data points and times for collection required to reach 0.5 foot of equilibrium ANT at 0.05-foot intervals of NAPL recharge.
Filtering the data in accordance with the ASTM recommended guidelines of 0.05 to 0.1 foot of ANT change (recharge) between each data point results in reducing the gauging error and reducing data scatter. You can think of it as a technique to maximize the signal to noise ratio, where the signal is the recharge curve, and the noise is the gauging error.
This guidance is provided in order to ensure gauging errors do not dominate data sets while also ensuring data collection at a sufficient frequency to analyze data sets representing thicknesses on the order of 0.5 foot of equilibrium ANT, which is the lower limit recommended in ASTM (2013) for a baildown test.
Figure 2 shows a DvD graph for a baildown test recently conducted at a site in the Midwest. Notice that this data, which includes all 40 data points collected, exhibits no discernible trend and therefore cannot be analyzed.
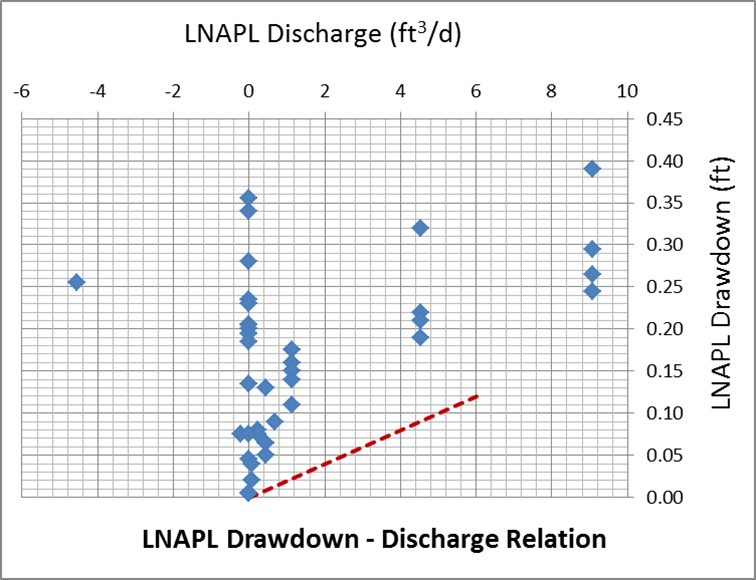
Figure 2. DvD plot of all 40 data points collected during a baildown test. Note the significant scatter and absence of any discernible trend(s).
Figure 3 shows the same dataset after removing 34 of the data points in accordance with the ASTM (2013) guidelines, leaving only 6 points to plot and analyze. The filtering process utilized selected points to represent consistent changes in thickness over log time. By holding to these principles and following the ASTM (2013) guidelines for gauging frequency, the filtering process will maintain objectivity.
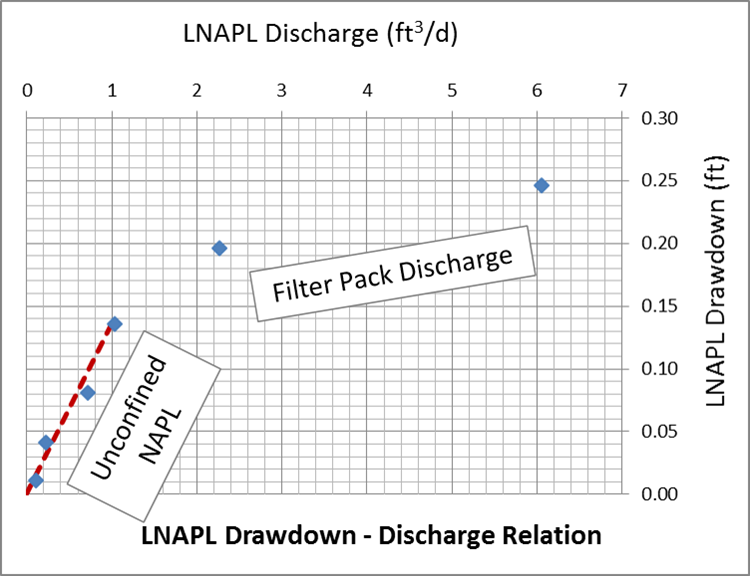
Figure 3. DvD plot of the same baildown test data shown in Figure 2 that has now been filtered to remove 34 of the 40 data points to achieve similar changes in ANT between each data point. Note the clear filter pack discharge and unconfined NAPL trends, and the absence of negative drawdown values.
Figure 4 is an overlay comparison of the hydrograph for both the unfiltered and filtered datasets, showing that the filtered data accurately reproduces the recharge profile of the baildown test, with the post-filtration points shown in black and gray.
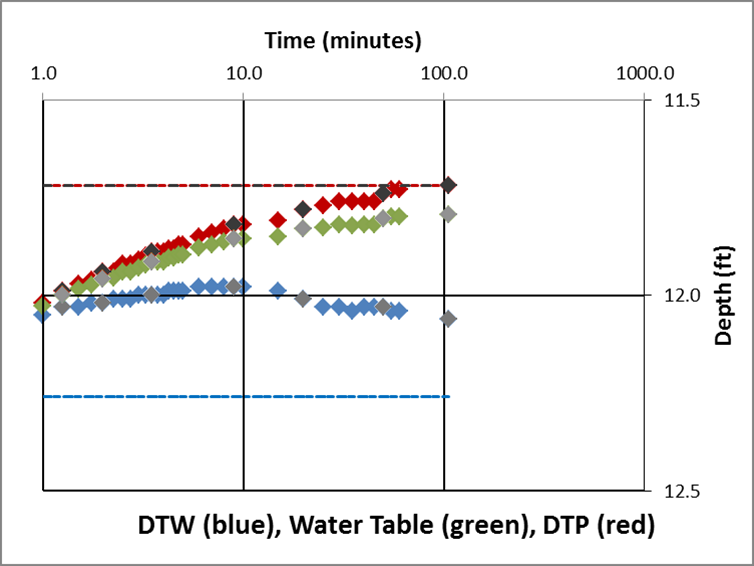
Figure 4. Hydrograph of the original complete dataset with the filtered dataset overlaid to show the relationship. The post-filtration data points retained are shown in black and gray. Note the logarithmic regularity of occurrence of these post-filtration data points throughout the original dataset in accordance with ASTM E2856 gauging recommendations for baildown test data.
This dataset can now be interpreted and analyzed to
- Identify the LNAPL hydrogeologic condition (unconfined);
- Identify the mobile NAPL interval; and
- Calculate LNAPL transmissivity.
A Word of Caution: While filtration is a powerful tool that can be applied to reveal diagnostic trends and provide datasets capable of analysis from baildown tests, there is always risk inherent in altering field data. Ensure that any filtration is net neutral and does not alter the overall data trend, and follow ASTM guidelines for gauging frequency. Such adjustments should be applied with caution and only by knowledgeable and experienced analysts.
For Further Reading:
ASTM (2013), Standard Guide for Estimation of LNAPL Transmissivity, ASTM E2856 – 13
Research Corner

Thank you to Dr. Tom Sale of the Colorado State University, Center for Contaminant Hydrology, for providing access to selected graduate level NAPL research.
Direct Measurement of LNAPL Flux Rates Using a Periodic Mixing Tracer Test
Click to download thesis
Tim Smith
Master of Science
Colorado State University
Abstract: Light non-aqueous phase liquids (LNAPLs) have been inadvertently released into the environment. LNAPLs can be managed in a variety ways at impacted sites depending on their volume, extent, location, recoverability, and stability. The primary concern at some sites site is the stability of an LNAPL plume. Direct measurement of LNAPL flux rates will be most accurate way to characterize stability. A novel approach is presented that improves upon past methods of direct measurement of LNAPL flux rates. The novel approach is a single well periodic mixing tracer dilution test (PMT). The main improvement of the PMT is the elimination of the need for dedicated in-well equipment to maintain the assumption of a “well-mixed” reactor (WMR) required for traditional single well tracer dilution techniques. Removing the WMR assumption greatly simplifies conducting concurrent single well tests. The PMT is presented with a derivation that is validated through laboratory and field experiments. The laboratory experiments included a proof of concept experiment and a large tank experiment that successfully tested the PMT in a three-phase porous media system. The field experiments consisted of testing the PMT in areas with high LNAPL flux rates and in areas with low LNAPL flux rates. A total of eight PMTs were conducted in the field, with four PMTs occurring in areas with high LNAPL flux rates and four PMTs occurring in areas with low LNAPL flux rates. The measured LNAPL flux rates from the PMTs in areas with high LNAPL flux rates were compared to the known LNAPL formation discharges from local LNAPL recovery wells. The measured LNAPL flux rates were in good agreement with the actual LNAPL formation discharges. The three of four PMTs that occurred in areas of low LNAPL flux rates yielded LNAPL flux rates representative of site conditions. Overall, the PMT provides a less complex method to characterize site wide LNAPL stability, which could aid in the management of LNAPL plumes at impacted sites.
The primary objective of ANSR is the dissemination of technical information on the science behind the characterization and remediation of Light and Dense Non-Aqueous Phase Liquids (NAPLs). Expanding on this goal, the Research Corner has been established to provide research information on advances in NAPL science from academia and similar research institutions. Each issue will provide a brief synopsis of a research topic and link to the thesis/dissertation/report, wherever available.
Practical Stats
Top Twelve Tip #1:
Plot the Data First!
Dr. Dennis Helsel
www.practicalstats.com
Below are four data sets that have the same correlation coefficient r, same r-squared, same slope and intercept of the line, same t-test for significance of the slope, etc. Just looking at a number like r-squared to decide if your (here regression) analysis is beneficial is not a good workflow! You could be led astray. The upper left graph is the type of data you might assume occurs. It may be quite different than that!

Nothing replaces a good plot to give you insight into your data analysis.
Related Links
API LNAPL Resources
ASTM LCSM Guide
Env Canada Oil Properties DB
EPA NAPL Guidance
ITRC LNAPL Resources
ITRC LNAPL Training
ITRC DNAPL Documents
RTDF NAPL Training
RTDF NAPL Publications
USGS LNAPL Facts
ANSR Archives
Coming Up
Look for more articles on LNAPL transmissivity as well as additional explanations of laser induced fluorescence, natural source zone depletion and LNAPL Distribution and Recovery Modeling in coming newsletters.
Announcements
An updated version of the ASTM Guide for Calculating LNAPL Transmissivity is Now Available for Purchase at www.astm.org.
ASTM Standard E2856 – Standard guide for Estimation of LNAPL Transmissivity is now available
The ASTM LNAPL Conceptual Site Model (LCSM) workgroup is actively updating the ASTM LCSM guidance document. If you are interested in participating on this team or would like to send comments for consideration – please contact Andrew Kirkman of BP Americas (team leader).
ANSR now has a companion group on LinkedIn that is open to all and is intended to provide a forum for the exchange of questions and information about NAPL science. You are all invited to join by clicking here OR search for “ANSR – Applied NAPL Science Review” on LinkedIn. If you have a question or want to share information on applied NAPL science, then the ANSR LinkedIn group is an excellent forum to reach out to others internationally.