Applied NAPL Science Review (ANSR)
Demystifying NAPL Science for the Remediation Manager
Review Board:
J. Michael Hawthorne, PG, Board of Chairman, GEI Consultants, Inc.
Mark Adamski, PG, BP America
Dr. Randall Charbeneau, University of Texas
Dr. Sanjay Garg, Shell Global Solutions
Dr. Terrence Johnson, United States Environmental Protection Agency
Andrew Kirkman, PE, AECOM
Mark Malander, ExxonMobil Environmental Services
Discharge vs. Drawdown (DvD) Graphs
Graphical Analysis of Unconfined LNAPL Baildown Test Data
Andrew Kirkman, PE – AECOM
Efficient LNAPL remediation design is dependent upon reliable predictions of LNAPL production, which in turn may be dependent upon calculated LNAPL transmissivity distributions for a site. Accurate LNAPL transmissivity calculations from baildown tests require accurate drawdown measurement and interpretation. In this issue we will focus on DvD Graphs diagnostic of unconfined LNAPL conditions.
BACKGROUND: Discharge versus Drawdown (DvD) Graphs are used in conjunction with LNAPL baildown tests to graphically confirm ideal unconfined LNAPL discharge conditions. The theory behind measurement of LNAPL transmissivity (Tn) via baildown testing is similar to the theory behind aquifer slug testing. Bouwer and Rice (1976) showed that under ideal conditions discharge during a slug test is directly proportional to drawdown.
DEFINITION: A Discharge versus Drawdown (DvD) Graph is a scatter plot of LNAPL recharge into a well (recharge into a well includes any initial filter pack drainage and the discharge from the formation) during a baildown test versus the LNAPL drawdown. Typically LNAPL drawdown is calculated as either 1) change in air/NAPL (AN) interface or 2) change in apparent NAPL thickness (ANT) times the quantity one minus the LNAPL specific gravity. Both methods assume unconfined conditions, but the ANT method also assumes a constant potentiometric surface.
Discharge may occur from the well filter pack and/or from one or more lithologic intervals of mobile LNAPL. Under ideal subsurface fluid flow conditions, discharge is directly proportional to drawdown. Therefore, a DvD graph of ideal unconfined LNAPL response should exhibit a constant rate of change (constant slope or straight line).
INTERPRETATION: Ideally, both discharge and drawdown will approach zero simultaneously as LNAPL and groundwater recharge approach equilibrium conditions. Failure of both values to approach zero together may indicate a non-equilibrium initial (pre-test) LNAPL elevation, which can lead to substantial error in LNAPL transmissivity values calculated from such baildown tests.
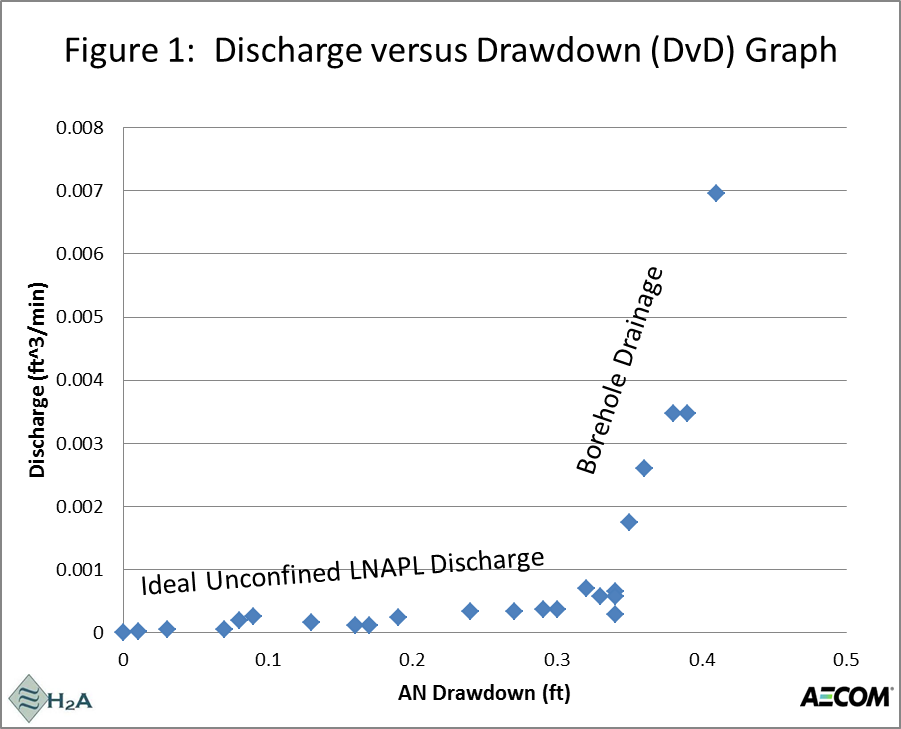
Frequently the early data from a baildown test is representative of filter pack drainage rather than formation discharge. Filter pack drainage in Figure 1 can be recognized as an initially steeper discharge versus drawdown relationship (higher rate of change in discharge per unit drawdown). This is similar to the double straight line effect observed from slug tests analyzed with the Bouwer-Rice method for wells screened across the water-table.
DvD Graphs can also be constructed with drawdown expressed as an elevation on the vertical axis and discharge on the horizontal axis. Figure 2 shows an elevation-based DvD graph that incorporates static and recharge AN and NW interface elevations as well as ANT recharge versus LNAPL drawdown. The DvD Graph may then be evaluated against elevation-based boring logs or cross-sections, or used to create an advanced Hydrostratigraph for the well. Discharge trends may be matched directly to lithologic zones and LNAPL interface and thickness trends on the Hydrostratigraph.