Applied NAPL Science Review
Demystifying NAPL Science for the Remediation Manager
ANSR Scientific Review Board
J. Michael Hawthorne, PG, Board of Chairman, GEI Consultants Inc.
Mark Adamski, PG, BP Americas
Dr. Randall Charbeneau, University of Texas
Dr. Sanjay Garg, Shell Global Solutions (US) Inc.
Dr. Terrence Johnson, USEPA
Andrew J. Kirkman, PE, AECOM
Mark W. Malander, ExxonMobil Environmental Services
Applied NAPL Science Review (ANSR) is a scientific ejournal that provides insight into the science behind the characterization and remediation of Non-Aqueous Phase Liquids (NAPLs) using plain English. We welcome feedback, suggestions for future topics, questions, and recommended links to NAPL resources. All submittals should be sent to the editor.
LCSM Tools:
Conversion of TPH in Soil to NAPL Saturation
Andrew Kirkman, PE – AECOM
BACKGROUND: Diagnostic indicators, measurement methods and tools to evaluate LNAPL in soil include: 1) visual observations of LNAPL presence / absence in soil samples, 2) photoionization readings of soil samples (e.g., during drilling), 3) Laser Induced Fluorescence (LIF) and similar tools, 4) laboratory analysis of LNAPL saturation in soil, and 5) laboratory analysis of Total Petroleum Hydrocarbon (TPH) concentrations in soil samples. Of these methods, only NAPL saturation and TPH laboratory analyses are quantitative.
An understanding of the distribution of NAPL saturation values in soil is critical for a sound LNAPL conceptual site model (LCSM). However, saturation analyses can be time-consuming and costly to obtain and may not be available for older sites. Frequently, only a few saturation values are available even for sites where such samples were obtained. In these cases, results of NAPL saturation and TPH in soil values may be merged for comparison and analysis through the conversion of TPH in soil analytical results to NAPL soil saturation values.
The conversion from milligrams of hydrocarbon per kilogram of soil (mg/kg TPH in soil) to liters of oil per liter of soil pore space (% saturation) is fairly simple. However, substantial error may arise if the TPH method used for testing does not fully cover the range of NAPL constituents present (biased low), or if results for two TPH methods with overlapping ranges are added together (biased high).
For example, if you have both diesel and gasoline present in the subsurface at a site, you should not attempt to convert from TPH to percent saturation if you only have TPH(GRO) [gasoline range organics] or TPH(DRO) [diesel range organics].
Calculation: Equations 1a and 1b are two forms of the same equation that provide estimates of NAPL saturation based on TPH in soil. The original, detailed equation includes terms for NAPL in multiple phases (i.e., sorbed, dissolved, vapor) (Feenstra et al, 1991; Parker et al, 1994; Brost and DeVaull, 2000; Sale, 2001). However, critical inputs for these detailed equations can be difficult to obtain or estimate accurately.
LNAPL saturation and TPH in soil both involve an initial extraction of the soil sample in a solvent, although the extraction techniques and solvents are different. The extract is subsequently analyzed by Gas Chromatography (for TPH) or gravimetrically (for saturation). The solvent extracts hydrocarbons from all soil sample phases – soil gas, pore water, soil organic carbon and NAPL. If LNAPL is present in the sample, the LNAPL contribution dominates the other phases. Brost and DeVaull (2000) provide soil TPH concentrations (Csat) above which LNAPL can be assumed to be present in soil.
In these equations, the calculated NAPL saturation (Sn) is a dimensionless ratio, TPH is input in units of mg/kg, porosity is dimensionless, and LNAPL density is in units of g/cm3.
Equation 1a – Soil Grain Density Based Form of the TPH in Soil to NAPL Saturation Equation:
![]()
The grain density based form of the equation is useful because the grain density for quartz dominated sediments is commonly (though not universally) applicable, with a well-established mean value of 2.65 g/cm3.
Site-specific bulk density values must be known in order to use the second form of the equation. Bulk density generally varies from approximately 1.4 to 1.8 g/cm3, though values outside this range may occur. Units are the same as Equation 1a.
Equation 1b – Soil Bulk Density Based Form of the TPH in Soil to NAPL Saturation Equation:

Grain Density and Bulk Density are related as shown in Equation 2.
Equation 1b – Soil Bulk Density Based Form of the TPH in Soil to NAPL Saturation Equation:

In general, the estimated saturation values from the simplified equations are more accurate for higher TPH values and for NAPLs with smaller concentrations of soluble or volatile chemical components. A suggested lower limit for TPH in this conversion is 5,000 mg/kg. Readers interested in more detail should see the listed references, below.
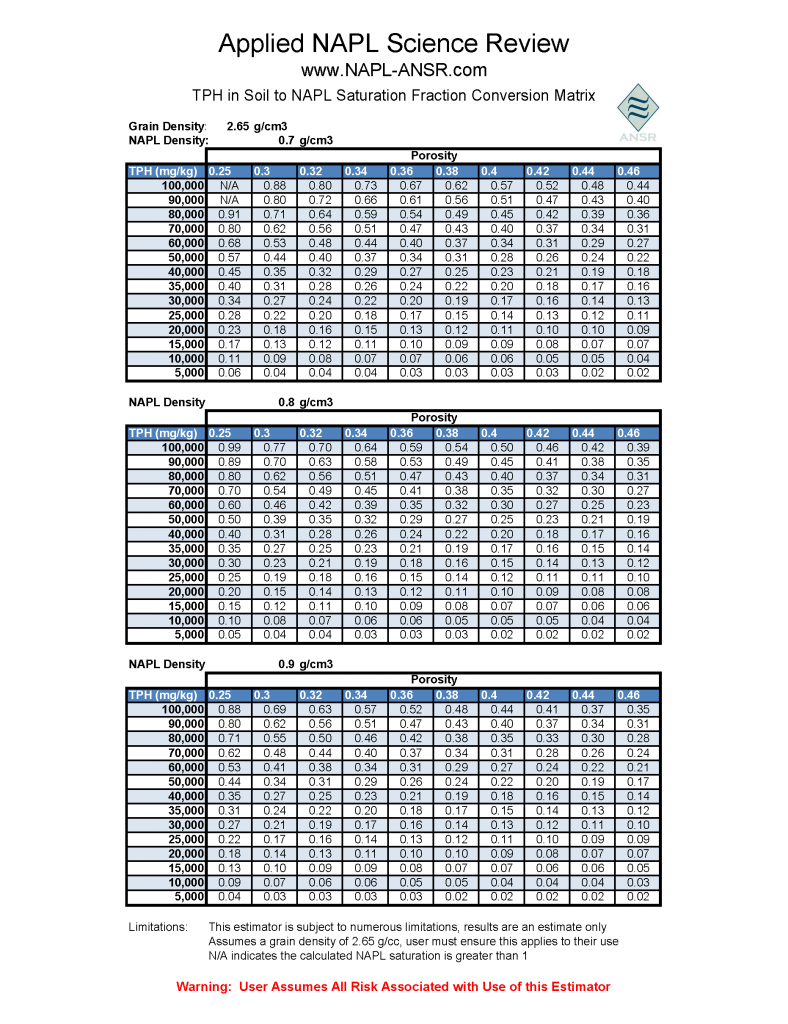
Conversion Tools: The TPH to Saturation Conversion Matrix (attached table) provides a tabular tool to estimate NAPL saturation from TPH in soil. The matrix assumes a Grain Density of 2.65 g/cm3, which is generally valid for quartz dominated soils. Simply select the table for the closest LNAPL density value, then find the intersecting LNAPL saturation cell for the appropriate soil porosity and TPH values.
The “TPH / Saturation Relationship Graph” provides the LNAPL saturation estimation function assuming an LNAPL density of 0.8 g/cm3, and provides a visual understanding of the mathematical relationship between TPH in soil and percent saturation. This figure also provides a graphical “quick conversion” tool. Assuming a similar LNAPL density, find the intersection of the porosity (y axis) and TPH in soil value (x axis). Plotted lines are the resulting LNAPL saturation in soil.

References:
Feenstra, Stan; Mackay, John and Cherry, John (1991) A Method for Assessing Residual NAPL Based on Organic Chemical Concentrations in Soil Samples, Groundwater Monitoring and Remediation, Spring 1991, pp 128-136.
Brost, Edward J. and DeVaull, George E. (2000) Non-Aqueous Phase Liquid (NAPL) Mobility Limits in Soil, Soil and Groundwater Research Bulletin No. 9, June 2000, American Petroleum Institute, 10 p.
Parker, J.C., Waddill, D.W., and Johnson, J.A. (1994). UST Corrective Action Technologies: Engineering Design of Free Product Recovery Systems, US EPA. Risk Reduction Engineering Laboratory, Edison, N.J., pp 27-28.
Sale, Tom (2001) Methods for Determining Inputs to Environmental Petroleum Hydrocarbon Mobility and Recovery Models, API Publication No. 4711, July 2001, 39 p.
Weidemeir, T.H., H.S. Rifai, C.J. Newell and J.T. Wilson (1999) Natural Attenuation of Fuels and Chlorinated Solvents, Chapter 2, John Wiley and Sons NY, NY, 617 p.
Real World Limitations: A word of caution – many factors can affect the accuracy of the estimated saturation values derived from the conversion equations and tools presented. For example, use of a TPH in soil analytical method that does not accurately quantify the full range of hydrocarbon components present in the LNAPL. The estimated saturation values derived from these conversion tools can be useful approximations to improve a site LNAPL conceptual site model (LCSM), and should be used accordingly.