Applied NAPL Science Review
A Weight-of-Evidence Approach to Characterize Pore-Scale NAPL Mobility in Sediment Samples
Editor: Lisa Reyenga, PE
ANSR Scientific Advisory Board
J. Michael Hawthorne, PG, Board Chairman, GEI Consultants, Inc.
Andrew J. Kirkman, PE, BP Corporation North America
Robert Frank, RG, Jacobs
Paul Cho, PG, CA Regional Water Quality Control Board-LA
Randy St. Germain, Dakota Technologies, Inc.
Dr. Terrence Johnson, USEPA
Brent Stafford, Shell Oil Co.
Douglas Blue, Ph.D., Imperial Oil Environmental & Property Solutions (Retired)
Natasha Sihota, Ph.D., Chevron
Kyle Waldron, Marathon Petroleum
Danny D. Reible, Professor at Texas Tech University
Reeti Doshi, National Grid
Applied NAPL Science Review (ANSR) is a scientific ejournal that provides insight into the science behind the characterization and remediation of Non-Aqueous Phase Liquids (NAPLs) using plain English. We welcome feedback, suggestions for future topics, questions, and recommended links to NAPL resources. All submittals should be sent to the editor.
DISCLAIMER: This article was prepared by the author(s) in their personal capacity. The opinions expressed in this article are the author’s own and do not necessarily reflect the views of Applied NAPL Science Review (ANSR) or of the ANSR Review Board members.
A Weight-of-Evidence Approach to Characterize Pore-Scale NAPL Mobility in Sediment Samples
Michael J. Gefell, Anchor QEA, LLC
Laboratory NAPL mobility test results can be used in a weight of evidence approach to interpret whether the NAPL in a given sediment sample would likely be mobile or immobile at the pore scale under field conditions.
When non-aqueous phase liquid (NAPL) is identified in sediment, a NAPL emplacement and movement evaluation is typically warranted to assess whether the NAPL is mobile or migrating. The evaluation process is discussed in ASTM E3248-20 and summarized in Reyenga 2021a. Sample collection and handling are discussed in ASTM 3268-20. A variety of metrics that can be used to evaluate potential NAPL movement in sediments is discussed in Reyenga 2021b, and specific testing and decision-making guidelines are provided in ASTM E3282-21. Figure 1 summarizes key decision points. These methods are also applicable for assessing NAPL mobility in soil.
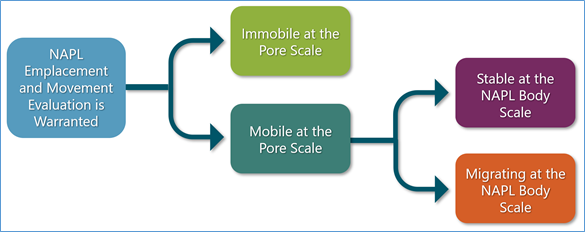
Figure 1 – General NAPL movement evaluation framework, adapted from ASTM E3282-21
The first key decision point is whether or not the NAPL is immobile or mobile at the pore scale. If NAPL is immobile at the pore scale, then it is also incapable of migrating via advection at the NAPL body scale. If NAPL is mobile at the pore scale, it may be either stable or migrating at the NAPL body scale. To help evaluate whether NAPL is immobile or mobile at the pore scale, it is common practice to perform laboratory NAPL mobility testing and evaluate the results. Interpreting the results with multiple lines of evidence (LOEs) using a weight-of-evidence evaluation method adds credibility to the resulting interpretations regarding the test results. Also, a tiered testing approach can be used as discussed in Berggren 2021.
Laboratory NAPL Mobility Tests
Two classes of NAPL mobility tests are centrifuge tests and water-drive tests. Centrifuge tests exert a centrifugal force to cause fluids to drain from the sample. Water-drive tests, also known as water‑flood tests (Niemet et al. 2015), involve pumping water through a test sample (typically in an upward direction) to force NAPL to express from the sample. To be conservative, most test samples are usually collected from specific depths with the most notable NAPL presence.
At most sediment sites, field hydraulic gradients associated with groundwater flow are typically less than 0.1 m/m. Centrifuge tests and water‑drive tests usually impose artificial hydraulic gradients orders of magnitude greater than those observed in the field. Therefore, if no NAPL is produced from a given test sample under aggressive laboratory test conditions, the NAPL in the sample is deemed immobile (ASTM E3282 – 21). When the test sample expresses NAPL, however, that does not necessarily mean that the NAPL in the sample is mobile at the pore scale under field conditions. A weight of evidence (WOE) data evaluation approach can be used to help interpret whether the NAPL in a given NAPL mobility test sample would likely be mobile or immobile at the pore scale under typical field conditions (ASTM E3282-21).
Example WOE Approach to Interpret NAPL Mobility Test Results
Table 1 presents an illustrative example of a WOE approach to interpret whether the NAPL in a given NAPL mobility test sample would likely be mobile or immobile at the pore scale under typical field conditions. The approach includes five lines of evidence (LOEs), a scoring method for each LOE, and the rationale behind the scoring method (based on Gefell 2018 and adapted from ASTM E3282 – 21). In this procedure, NAPL saturation is defined as the percent of pore volume occupied by NAPL.
Line of Evidence | Scoring | Scoring Rationale |
1. NAPL expressed during single step centrifuging or water drive testing of sample (typical laboratory hydraulic gradient >10 m/m) | +1 if NAPL not expressed | Test conditions are very conservative compared to the field, so no NAPL expressed indicates NAPL is immobile. Even if NAPL is expressed under these very conservative conditions, it might still be immobile under field conditions. |
2. NAPL expressed during lowest gradient step (typically hydraulic gradient of ≤10 m/m) in water drive or centrifuge testing of sample (multi-stage testing) | +1 if NAPL not expressed | Conditions still conservative compared to the field, so no NAPL expressed indicates NAPL is immobile. If NAPL is expressed under these conditions, it could be mobile under field conditions. |
3. Calculated NAPL effective hydraulic conductivity (refers only to the NAPL phase) | +1 if <10-7 cm/s* | At effective hydraulic conductivities <10-7 cm/s*, NAPL is effectively immobile at the pore scale. At greater NAPL effective hydraulic conductivities, it may be mobile. |
4. Initial NAPL saturation in water-saturated sediment sample | +1 if <10 % | For NAPL in water-saturated sediments, 30 % is near the upper end of the expected range for transition from mobile to immobile saturation, while 10 % is near the lower end of the expected range for transition from mobile to immobile saturation. |
5. Difference in NAPL saturation value before and after mobility laboratory test | +1 if <10 % different from initial NAPL saturation value | If change in NAPL saturation during the test is <10 % of initial value (back calculated using final saturation and quantity of NAPL expressed from sample), NAPL in the sample must be near immobile saturation, or near depletion. If >10 % different from initial value, the NAPL may be mobile. |
Table 1: Example WOE NAPL mobility evaluation approach, based on Gefell 2018 and adapted from ASTM E3282-21
Note: * – For qualitative comparison, these Kn values are less than typical in situ solidification (ISS) performance standards, which are approximately 10-7 cm/s (ITRC 2011).
If no data are collected for a LOE, then that LOE is assigned a WOE score of zero. The scores for all of the LOEs are then totaled to give a WOE score. If the WOE score is positive (>0), then the NAPL is considered to be immobile at the pore scale under field conditions by the WOE evaluation. If the WOE score is less than or equal to zero (≤0), then the NAPL is considered to be mobile at the pore scale under field conditions by the WOE evaluation.
Discussion
Applying this WOE NAPL mobility evaluation approach is straightforward: 1) score each LOE; 2) sum the scores; and 3) interpret the results.
LOE 3 is the calculation of NAPL effective hydraulic conductivity based on the NAPL volume that was discharged from the test sample during the NAPL mobility test (Gefell et al. 2018; Gefell 2021). NAPL effective hydraulic conductivity is the volumetric flow rate of NAPL per unit cross-sectional area under the influence of a unit hydraulic gradient, and accounts for the key physical factors that influence the ability of NAPL to flow through soil or sediment, including: soil or sediment pore sizes; NAPL viscosity, saturation, relative permeability; and wettability.
LOE 4 is supported by the literature (Cohen and Mercer 1993; Barranco and Dawson 1999; Hugaboom and Powers 2002; USEPA 2004; EPRI 2004; Niemet et al. 2015).
LOE 5 is based on the principle that if the NAPL saturation changed minimally in response to aggressive, conservative NAPL mobility test conditions, then under typical field conditions the NAPL would likely be immobile.
Example Application of WOE Evaluation Method
During NAPL mobility evaluation at a particular site, co-located sediment samples were collected at a particular sampling location and depth and underwent a tiered laboratory testing and data evaluation process. The first stage of laboratory NAPL mobility testing involved centrifuging the sediment sample with an equivalent hydraulic gradient of 25 m/m for 10 hours; NAPL was expressed from the test sample. Therefore, a second stage of testing was conducted using a co-located sediment sample from the same depth, with multiple steps of water-drive testing conducted at hydraulic gradients of 0.5, 2, and 4 m/m; NAPL was expressed from the sample during the first test step. The initial and final NAPL saturations for the first stage test sample were 20.8% and 20.2% of pore space, respectively. The initial and final NAPL saturations for the second stage test sample were 26.1% and 25.5% of pore space, respectively. Based on the test results, the NAPL effective hydraulic conductivity from the first stage and second stage tests were calculated as 2×10⁻⁸ cm/s and 5×10⁻⁸ cm/s, respectively.
Based on these results, the WOE score was evaluated as follows.
- LOE 1: NAPL expressed – LOE score = 0
- LOE 2: NAPL expressed – LOE score = -1
- LOE 3: NAPL effective hydraulic conductivity <10-7 cm/s – LOE score = +1
- LOE 4: Initial NAPL saturation between 10% and 30% – LOE score = 0
- LOE 5: The final NAPL saturation values were <10% different from the initial NAPL saturation
values – LOE score = +1 - Sum of LOE scores =+ 1
Conclusions
The example WOE process described herein provides an objective procedure to characterize whether the NAPL in a NAPL mobility test sample would likely be mobile or immobile at the pore scale under field conditions. Using multiple LOEs and evaluating them holistically in a WOE process enhances confidence in the resulting interpretations regarding pore scale NAPL mobility. Also, even of the NAPL is mobile at the pore scale, it may or either stable or migrating at the NAPL body scale.
A Word of Caution
The WOE process described herein is one illustrative example that was adapted from ASTM E3282 – 21. Alternative WOE approaches could also be used. Examples of changes that could be made include adding or subtracting LOEs, using alternate scoring or weighting of scores for a given LOE, or using different quantitative metrics for LOE 3, LOE 4, and/or LOE 5.
To develop a robust assessment of NAPL movement at a given site, it is prudent to perform multiple NAPL mobility tests using samples with a range of NAPL abundance, including multiple samples with the most notable NAPL presence.
References
ASTM E3248−20. 2020. “Standard Guide for NAPL Mobility and Migration in Sediment – Conceptual Models for Emplacement and Advection.”
ASTM E3268−20. 2020. “Standard Guide for NAPL Mobility and Migration in Sediment – Sample Collection, Field Screening, and Sample Handling.”
ASTM E3282−21. 2021. “Standard Guide for NAPL Mobility and Migration in Sediments – Evaluation Metrics.”
Barranco, F.T., and H.E. Dawson. 1999. “Influence of Aqueous pH on the Interfacial Properties of Coal Tar,” Environmental Science and Technology, Vol. 33, pp. 1589 – 1603.
Berggren, D.R.V., 2021. “Using a Tiered Framework for NAPL Movement Evaluations”. Applied NAPL Science Review, Vol. 9, Issue 7, November 2021.
Cohen, R.M., and J.W. Mercer. 1993. DNAPL Site Evaluation. C.K. Smoley, CRC Press, Boca Raton, Florida.
Electric Power Research Institute (EPRI). 2004. “Residual Saturation of Coal Tar in Porous Media,” EPRI Report Number 1009426, Final Report, April 2004.
Gefell, M. J., 2018. “Challenges in Residual Saturation Definition,” presented at 34th Annual International Conference on Soils, Sediments, Water and Energy; AEHS Foundation, Amherst, Massachusetts, October 15-18, 2018.
Gefell, M., K. Russell, and M. Mahoney. 2018. “NAPL Hydraulic Conductivity and Velocity Estimates Based on Laboratory Test Results,” Groundwater, Vol. 56, No. 5, pp. 690 – 694.
Gefell, M.J., 2021. “Estimating NAPL Hydraulic Conductivity and Migration Rate Based on Laboratory Test Results”. Applied NAPL Science Review, Vol. 9, Issue 3, May 2021.
Hugaboom, D.A. and S.E. Powers. 2002. “Recovery of Coal Tar and Creosote from Porous Media: The Influence of Wettability,” Ground Water Monitoring and Remediation, Vol. 22, pp. 83 – 90.
Interstate Technology Regulatory Council (ITRC). 2011. “Development of Performance Specifications for Solidification/Stabilization,” Prepared by Solidification/Stabilization Team, Washington, DC, July 2011.
Niemet, M.R., J.L. Gentry, B. Morgan, D.R.V. Berggren, and C.D. Tsiamis. 2015. “Gowanus Canal Superfund Site. I: NAPL Mobility Testing of MGP-Impacted Sediments,” Journal of Hazardous, Toxic, and Radioactive Waste, Vol. 19, No. 1, pp. C4014003-1 – C4014003‑12.
Reyenga, L., 2021a. “Evaluating Emplacement and Movement of NAPL in Sediment”. Applied NAPL Science Review, Vol. 9, Issue 1, February 2021.
Reyenga, L., 2021b. “Typical Metrics for Evaluating Advective NAPL Movement in Sediments”.
Vol. 9, Issue 5, August 2021.
U.S. Environmental Protection Agency (USEPA). 2004. “Site Characterization Technologies for DNAPL Investigations,” Publication Number 542-R-04-017, Office of Solid Waste and Emergency Response (5102G), September 2004.
Research Corner

Analysis of Contaminant Mass in Place in Transmissive and Low-k Zones
Eric Roads
Master of Science
Colorado State University
Abstract:
Contaminant hydrology has been challenged by the common perception of homogeneous subsurface media. Previous sampling methods neglect the importance of differentiating between transmissive and low-k zones. Cryogenic core collection is a high-resolution sampling technique that can highlight the occurrence of transmissive and low-k zones as well as the distribution of contaminants in transmissive and low-k zones. Cryogenic core collection uses a CSU patented process that preserves core samples downhole using liquid nitrogen. Frozen cores are shipped to CSU on dry ice and always kept at -80ᵒC. Cores are cut into subsamples and analyzed to determine geology, physical properties, contaminant concentrations, and microbial ecology. The data is processed into Excel™ and then stored in gINT™, a relational database. Herein, consideration is given to 390 feet of collected core from 31 boreholes from 5 hydrocarbon and 2 chlorinated solvent sites. Data analyses include comparisons within a site, intra-site comparisons, and between sites, inter-site comparisons. Tools are developed in gINT™ to automate transformation of collected data into vibrant visual graphical outputs. First, for every borehole, a graphic is generated that includes a comprehensive panel of geology, contaminants of concern and fluid saturations properly presented by depth. Building on this, distributions of contaminants as a function of transmissive or low-k zones are resolved. Lastly, key attributes of mass distribution are compared across individual sites (intra-site comparisons) and between sites (inter-site comparisons). Our analysis presents a first-ever quantification of distribution of contaminant mass in transmissive and low-k zones. The analysis begins with processing concentration data-by-depth to produce the total mass of contaminants in each borehole, the mass of contaminants in transmissive zones, and the mass of contaminants in low-k zones. The contaminant mass in a borehole is presented for each contaminant individually and as sum of all contaminants. The visualization of this data is not intuitive due to the ranges of contaminant mass in place. Hydrocarbons contaminated sites have contaminant masses that range from less than half a kilogram to about 30 kilograms of contaminants per m2. Chlorinated solvent contaminated sites have contaminant masses that vary from less than 240 micrograms to right under 2.5 kilograms of contaminants per m2. The data is processed such that boreholes and sites with broad ranges of conditions can be compared. Data is presented as percent of contaminant mass in transmissive zones by borehole; the percent of contaminant mass in low-k zones by borehole, the percent of borehole that is transmissive, and percent of borehole that is low-k. Unlike previous data that required a y-axis formatted to a log scale, this data is visualized on a plot with the y-axis set at 0-100%. The fraction of a borehole that is low-k ranges between 0% and 94% with a median value of 52%. Secondly, the fraction of total contaminant mass stored in low-k zone ranges from 1% to 96% with a median value of 46%. Illustrations of the tendency for mass storage in low-k zones are presented through difference in percent of borehole that is low-k and percent of contaminants in a borehole in low-k zones. The calculations defined a positive difference as preference for transmissive zones and a negative difference as preference for low-k zones. Data presented characterized the 18 hydrocarbon contaminated boreholes, 12 chlorinated solvent contaminated boreholes, and all 30 contaminated boreholes respectively. Key insights include:
- Hydrocarbon contaminated boreholes showed statistically significant preference for low-k zones if the unit difference of percent of borehole that is low-k and percent of contaminants in a borehole in low-k zones was less than -24%. • Chlorinated solvent contaminated boreholes showed statistically significant preference for low-k zones if the unit difference of percent of borehole that is low-k and percent of contaminants in a borehole in low-k zones was less than -11%.
- Remediated chlorinated solvent boreholes presented a preference for low-k zones where their non-remediated counterparts showed preference for transmissive zones.
- All contaminated boreholes showed statistically significant preference for low-k zones if the unit difference of percent of borehole that is low-k and percent of contaminants in a borehole in low-k zones was less than -19%.
As an example, this thesis provides a unique documentation of benzene persisting in low-k zones. The presence or absence of benzene in low-k zones will have a large implication with respect to the longevity of benzene in monitoring wells and the efficacy of remedial measures that address the longevity of benzene in monitoring wells. Overall, cryogenic core collection and advanced analytics provides a practical means of quantifying contaminant occurrence in transmissive and low-k zones and an improved basis for anticipating the benefits of site remedies.
The primary objective of ANSR is the dissemination of technical information on the science behind the characterization and remediation of Light and Dense Non-Aqueous Phase Liquids (NAPLs). Expanding on this goal, the Research Corner has been established to provide research information on advances in NAPL science from academia and similar research institutions. Each issue will provide a brief synopsis of a research topic and link to the thesis/dissertation/report, wherever available.
Related Links
API LNAPL Resources
ASTM LCSM Guide
Env Canada Oil Properties DB
EPA NAPL Guidance
ITRC LNAPL Resources
ITRC LNAPL Training
ITRC DNAPL Documents
RTDF NAPL Training
RTDF NAPL Publications
USGS LNAPL Facts
ANSR Archives
Coming Up
In coming newsletters, look for more articles on NAPL movement in sediment in 2021. Moving forward we are planning articles on surfactant injection case studies, bioremediation, and natural source zone depletion. Let us know if you have article ideas or would like to see articles on other topics.
Announcements
The ASTM Standard Guide for NAPL Mobility and Migration in Sediments – Evaluating Ebullition and Associated NAPL/Contaminant Transport (E3300-21) is now available!
The ASTM Standard Guide for NAPL Mobility and Migration in Sediments – Evaluation Metrics (E3282-21) is now available!
The ASTM Standard Guide for NAPL Mobility and Migration in Sediments – Screening Process to Categorize Samples for Laboratory NAPL Mobility Testing (E3281-21) is now available!
The ASTM Standard Guide for NAPL Mobility and Migration in Sediment – Sample Collection, Field Screening, and Sample Handling (E3268-20) is now available!
The ASTM Standard Guide for NAPL Mobility and Migration in Sediment – Conceptual Models for Emplacement and Advection (E3248-20) is now available!
API has published the “API LNAPL Transmissivity Workbook Training Video” to assist with baildown test interpretation and identification of frequently encountered problems.
Check them all and join us on the ANSR LinkedIn page for discussion or to share your own tips and tricks!
Upcoming ITRC Training – Learn More Here.
- January 11: Remediation Management of Complex Sites
- January 13: Vapor Intrusion Mitigation Session 1: Conceptual Site Model for Vapor Intrusion Mitigation, Public Outreach, Rapid Response, Remediation & Institutional Controls
- January 25: 1,4-Dioxane: Science, Characterization & Analysis, and Remediation
- January 27: Vapor Intrusion Mitigation Session 2: Active Mitigation, Passive Mitigation Installation/ OM&M/Exit Strategy
- February 8: Connecting the Science to Managing LNAPL Sites 3-Part Series: Build upon your Understanding of LNAPL Behavior in the Subsurface (Part 1)
- February 10: Characterization and Remediation in Fractured Rock
- February 15: Connecting the Science to Managing LNAPL Sites 3-Part Series: Develop your LNAPL Conceptual Site Model and LNAPL Remedial Goals (Part 2)
- March 1: Connecting the Science to Managing LNAPL Sites 3-Part Series: Select/Implement LNAPL Technologies (Part 3)
- March 3: Optimizing Injection Strategies and In Situ Remediation Performance
- March 15: Sustainable and Resilient Remediation
- March 17: TPH Risk Evaluation at Petroleum-Contaminated Sites
Upcoming Conferences
- Battelle’s 2022 Sediments Conference, January 24-27, 2022 in Nashville, TN
- RemTECH & Emerging Contaminants Summit, March 8-10, 2022 in Westminster, CO.
- AEHS 31st Annual International Conference on Soil, Water, Energy, and Air, Host of the 7th Annual International Sustainable Remediation Conference (SustREM) March 14-17, 2022.
- Battelle’s 2022 Chlorinated Conference. May 22-26, 2022 in Palm Springs, CA.
- MGP Conference, September 28-30, 2022 in Rosemont, IL.
Upcoming Conference Abstract Deadlines
- MGP Conference – Abstracts due February 25, 2022
- 24th Railroad Environmental Conference – Opens January 2022
ANSR now has a companion group on LinkedIn that is open to all and is intended to provide a forum for the exchange of questions and information about NAPL science. You are all invited to join by clicking here OR search for “ANSR – Applied NAPL Science Review” on LinkedIn. If you have a question or want to share information on applied NAPL science, then the ANSR LinkedIn group is an excellent forum to reach out to others internationally.