Lisa Reyenga, PE, Board Chair, GEI Consultants, Inc.
J. Michael Hawthorne, PG, GEI Consultants, Inc.
Andrew J. Kirkman, PE, BP Corporation North America
Robert Frank, RG, Jacobs
Paul Cho, PG, CA Regional Water Quality Control Board-LA
Randy St. Germain, Dakota Technologies, Inc.
Dr. Terrence Johnson, USEPA
Brent Stafford, Shell Oil Co.
Douglas Blue, Ph.D., Imperial Oil Environmental & Property Solutions (Retired)
Natasha Sihota, Ph.D., Chevron
Kyle Waldron, Marathon Petroleum
Danny D. Reible, Professor at Texas Tech University
Reeti Doshi, National Grid
Mahsa, Shayan, Ph.D., PE, AECOM Technical Services
Chis Marks, Ph.D., Arizona Department of Environmental Quality
Kammy Sra, Ph.D., Chevron
David Edgerton, USEPA
Frequently Asked Questions
DISCLAIMER: This article was prepared by the author(s) in their personal capacity. The opinions expressed in this article are the author’s own and do not necessarily reflect the views of Applied NAPL Science Review (ANSR) or of the ANSR Review Board members.
Evaluating LNAPL body stability is critical to understand potential risks and the potential need for engineered LNAPL remediation. A stable LNAPL body does not have the potential to create new risks as the result of LNAPL migration into new areas. Stable LNAPL bodies are potential candidates for a risk-based and/or natural remediation approach to LNAPL management.
Introduction
During its initial release, LNAPL will move downward due to gravity, and if there is sufficient volume and head, it will eventually encounter the water table. The LNAPL will penetrate the water table and spread radially until a balance is achieved between the LNAPL head pressure and the capillary entry pressure in the soil and natural degradation at the edges of the LNAPL body. At this point, the 3-dimensional extent of the LNAPL body will not change in the future, barring additional releases or significant changes to subsurface conditions. This process typically takes a few months to several years (ITRC 2018, CL:AIRE 2014).
Evaluation of LNAPL body stability typically requires multiple lines of evidence (Table 1). Further details on lines of evidence for LNAPL body stability can be found in ITRC 2018 and Hawthorne 2013.
| Minimum Requirements | Scoring Rationale |
|---|---|
|
|
Dissolved-phase plume stability is also a reliable indicator of LNAPL body stability in situations where the full three-dimensional extent of the LNAPL body cannot be characterized due to site access restrictions (e.g., under buildings). If the dissolved-phase plume is fully delineated and stable or shrinking, the LNAPL body source is also stable or shrinking.
| Dissolved-Phase Plume Stability Condition | LNAPL Body Stability Condition |
|---|---|
| Shrinking | Shrinking |
| Stable | Shrinking or Stable |
| Expanding | Shrinking, Stable, or Expanding |
The Groundwater Spatiotemporal Data Analysis Tool (GWSDAT) is a free, open-source, user-friendly web application to perform dissolved-phase plume stability evaluations. GWSDAT includes tools such as:
- Time-series plots for each location and constituent provided;
- Mann-Kendall Trend evaluations (e.g., increasing, decreasing, stable);
- Threshold evaluations (e.g., above or below screening levels);
- Spatial visualizations of concentrations; and
- Estimations of plume mass, area, and average concentration over time.
GWSDAT is an accessible and efficient tool to perform dissolved-phase plume evaluations at the plume scale and/or for individual wells as lines of evidence in the LNAPL body stability evaluation.
Case Study
The Site was the location of a pipeline release of LNAPL. The data set includes 10 years of dissolved-phase concentrations of benzene from 2007 through 2016. During this time hydraulic recovery was conducted to remove LNAPL mass, but no active compositional change remedies were utilized to preferentially remove benzene from the LNAPL.
Figure 1 presents a spatial animation showing the interpreted concentration in the aquifer for each year of monitoring. The model interpolates through both space and time, so concentrations can be interpreted even where a location was not included in a particular monitoring event. Individual concentration data points are shown next to the well location. The red line indicates the extent of the plume corresponding to a benzene concentration of 5 µg/L (e.g., the Tier 1 screening threshold). The red cross indicates the location of the center of mass of the plume. The animation provides an excellent visual tool to illustrate the shrinking plume.
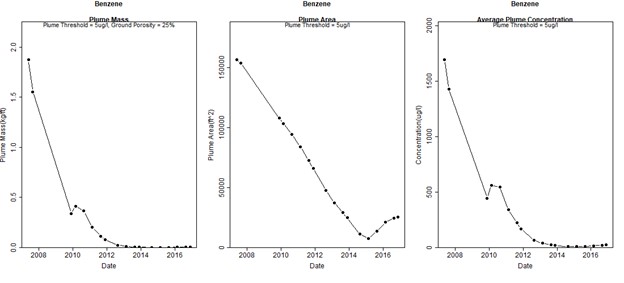
Figure 2 presents a series of graphs showing the calculated plume mass, area, and concentration over time using GWSDAT. These graphs illustrate a steady decrease from 2007 through approximately 2013. At that point concentrations greater than 10 µg/L are largely absent and the plume mass, area, and concentration stabilize. There is an apparent expanding trend in plume area from approximately 2014 through 2016. However, this is an artifact of changes in the monitoring program rather than actual plume expansion. During this time, only the perimeter wells were monitored, and no data points were collected in the interior of the plume.
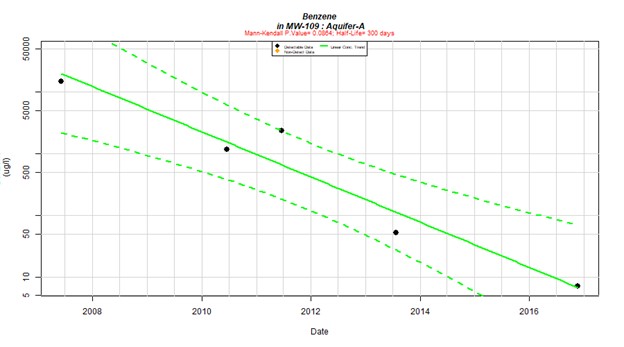
Figure 3 demonstrates the benzene concentrations over time for an example individual well. The concentration is on a log-scale, indicating that the benzene concentration is decreasing exponentially, consistent with natural attenuation. The Mann-Kendall p value (0.0864) is also shown on the graph. This result indicates a statistically significant decreasing trend.
A Word of Caution
References
Hawthorne, J. Michael. 2013. “LNAPL Body Stability, Part 1: Lines of Evidence.” Applied NAPL Science Review Vol. 3 Iss. 4, May 2013.
ITRC, 2018. Light Non-Aqueous Phase Liquids (LNAPL) Document Update: Evaluating and Implementing LNAPL Remedial Technologies. Interstate Technology Regulatory Council, LNAPL Update Team, pending publication March 2018. https://www.itrcweb.org/Team/Public?teamID=73
Research Corner

Colorado School of Mines
Abstract
The treatment of PFAS impacted groundwater by four GAC products was evaluated at a municipality near Colorado Springs, Colorado using a pilot-scale system operated for 7 months. Breakthrough of PFASs by GAC was influenced by perfluoroalkyl chain length and headgroup with breakthrough of longer chain PFASs and perfluorosulfonic acids (PFSAs) occurring later than shorter chain PFASs and perfluorocarboxylic acids (PFCAs), respectively. Greater adsorption capacity was found for GAC products containing high volumes of transport pores. A subsequent study compared a better performing GAC product evaluated from the prior study against three AER products in a similar groundwater for 13 months. For AERs, breakthrough of PFCAs followed compound chain length but breakthrough of PFSAs occurred at the same time for all AERs, possibly attributed to accumulation of metals from the source water in the AERs. Still, PFSAs exhibited greater adsorption affinity to AERs than PFCAs. AERs adsorbed 6-7 times more PFASs than GAC per unit media at breakthrough; however, based on volume of water treated at breakthrough, AERs and GAC performed similarly for PFCAs but better than GAC for PFSAs.
All AERs evaluated performed similarly. When media replacement is dictated by breakthrough of perfluorooctanoic acid (PFOA), similar operations and maintenance costs can be expected if AER media cost is ~3.5 times GAC media cost.
The impact of operating conditions, water matrix, and adsorption on rejection of PFASs by spiral-wound NF and RO membrane elements was evaluated. Membrane operating conditions did not have a significant impact on rejection of PFASs in a laboratory electrolyte matrix and was >98% by NF and >99% by RO. Rejection of the same PFASs present in a groundwater matrix by NF was lower, between 92-98%, and was attributed to water matrix effects. Adsorptive losses of longer-chain hydrophobic PFASs to the NF spiral wound membrane elements and the membrane system were observed but did not affect rejection of PFASs by NF. A subsequent study combined NF and UV-sulfite in a treatment train for the sequential removal and destruction, respectively, of PFASs in groundwater. Most PFASs were rejected to >95% by NF when operating at 90% permeate recovery. UV-sulfite treatment of the NF reject resulted in variable destruction of individual PFASs, with rates also being dependent upon pH and the identity and concentration of UV photosensitizer. Rates of PFCA degradation were greater than those measured for PFSAs and polyfluorinated PFASs and were independent of perfluoroalkyl chain length. In contrast, rates of PFSA degradation increased with increasing chain length. Collectively, >75% of the detected PFAS mass in the NF reject was destroyed after 4 h of UV treatment, increasing to 90% after 8 h of treatment. Electrical energy per order magnitude requirements for the NF and UV treatment train were estimated to be <13.1 kWh/m3 for all PFCAs and 14.1 kWh/m3 for PFOS.
Related Links
ANSR Archives
Coming Up
Announcements
Upcoming ITRC Training
- September 12, 2023: Optimizing Injection Strategies and In situ Remediation Performance
- September 14, 2023: ITRC PFAS Introductory Training
- September 21, 2023: ITRC: Pump & Treat Optimization
- September 28, 2023: Updates in Use of Qualified Data in HRS Evaluations
Upcoming IPEC Training
- August 22-24, October 3-5, and December 5-7: Petroleum Life Cycle: From Rocks to Drill Bits
- November 6-9: Essential Petroleum Economics & Decision-Making
- TBD: IPECONNECT | Petroleum Environmental Conference REIMAGINED (Virtual LIVE)
- November 14-15: Oil & Gas Acquisitions & Divestitures
- Online | On-Demand: Petroleum Engineering for Non-Engineers