Appendix I – SVE Technology Description
ESTCP (2002) Air Sparging Design Paradigm
- Site characterization and development of site conceptual model
- Preliminary feasibility assessment
- Pilot testing
- Design
- Monitoring
The pilot testing is divided into two approaches, 1) standard design approach and 2) site-specific design approach. For each of these two approaches there are default designs and recommended monitoring. The flow chart for air sparging design including pilot testing is shown in Figure B-1.
The standard design approach recommends the following data collection: injection pressure versus flow rate test, transient pressure response test, dissolved oxygen measurements, helium tracer test and soil gas sampling. Based on this data set, injection wells based on 15 ft centers and 20 ft3/min injection rate are recommended. The site-specific design approach recommends the standard methods plus sulphur hexafluoride tracer test to assess air distribution more accurately.
Overview of Technology
The phase change and mass removal typically decrease during the treatment life cycle. During early stages of remediation, the primary mass removal is from air pathways of low resistance (higher permeability soils), where chemicals in adsorbed phase or non-aqueous phase liquids (NAPL) partition into the moving air. Contaminants in lower permeability soils will not be removed by advection because soil vapors will preferentially flow through higher permeability soils. When the mass in higher permeability soils becomes mostly depleted, the rate of mass removal may approach a low value or cumulative mass recovery may approach an asymptotic value. This is because contaminants in lower permeability silts and clays and within the capillary fringe, if present, must desorb and diffuse into an advective flow path before they can be removed by the SVE system. If the rate of diffusion is slow, the time duration for removing VOCs may be significantly extended (US EPA 1991). US EPA (2018) describes a two-compartment model (coarse- and fine-grained) for prediction of concentrations and clean-up times when there are mass transfer limitations resulting from slow diffusive transport in fine-grained soil layers.
The addition of air through SVE may result in enhanced aerobic biodegradation and consequently SVE is closely related to bioventing (refer to Bioventing Factsheet). Because there is often contamination at or below the water table, remediation through air sparging will often be an additional component to the SVE system.
Exit Strategy Toolkit
Soil Vapor Extraction Factsheet
a) optimize SVE remediation performance, and
b) transition from SVE to natural attenuation, passive remediation, or “no further action”.
This factsheet should be read in conjunction with the overarching Compendium document that provides a broader context for application of SVE within a framework for remedial decision making.
This factsheet is not intended to provide detailed guidance on SVE and assumes that a sufficiently detailed conceptual site model (CSM) has been developed and SVE has been selected as an appropriate technology to meet remedial concerns and agreed remedial objectives (Appendix I and Appendix II). Additional details on SVE design and implementation can be found in US EPA (1991), US EPA (1994), US EPA (1997), USACE (2002), US EPA (2006), CAL EPA (2010), US EPA (2017) and US EPA (2018). The information found in the appendices and reference materials can be extremely helpful in supporting remedy implementation and facilitating the acceptance of risk-based approaches
SVE - Technology Summary
SVE is a remedial technology capable of addressing both composition-based concerns for soil vapor plumes and bulk mass reduction for residually impacted soil, but generally is not effective in addressing saturation-based concerns unless implemented in conjunction with multi-phase extraction. The technology is implemented by inducing controlled air flow through pumping, which enhances volatilization and removal of volatile constituents in light non-aqueous phase liquid (LNAPL) and petroleum hydrocarbon contamination in the unsaturated zone. Because higher volatility VOCs are removed at higher rates, SVE targets remediation of lighter molecular weight contaminants of concern (COCs), including risk-drivers such as benzene. Additionally, SVE stimulates hydrocarbon mass recovery via vadose zone bioremediation, and in some cases, both mechanisms (physical removal and biodegradation) may be important (see Bioventing Factsheet). SVE is often implemented in conjunction with air sparging to capture hydrocarbon vapors liberated from impacted groundwater (see Air / Bio Sparging Factsheet).
The rate of phase change and mass removal from SVE typically decreases during the treatment life cycle. During early stages of remediation, the primary mass removal is from air pathways of low resistance (higher permeability soils), where adsorbed chemicals or non-aqueous phase liquids (NAPL) partition into the moving air. When the mass in higher permeability or lower moisture content soils becomes mostly depleted, the cumulative mass removal may approach an asymptotic limit. Additional information on SVE technology is provided in Appendix I.
Remedial Concerns and Objectives
Caution should be used when defining COC-specific criteria based on mass recovery rates of total petroleum hydrocarbons (TPH) (e.g., an arbitrary number of kg/day) as such criteria are generally a function of site lithology and are poorly correlated with risk-based compositional objectives based on specific COCs. The remedial objectives may also include target timelines to achieve the risk-based threshold. Broader remedial decision making should also factor in potential liabilities associated with site risk, regulatory requirements, business plans and timelines, future redevelopment potential, sustainability, and economic factors. The remedial objectives should also incorporate the notion of technical practicability.
Performance Metrics
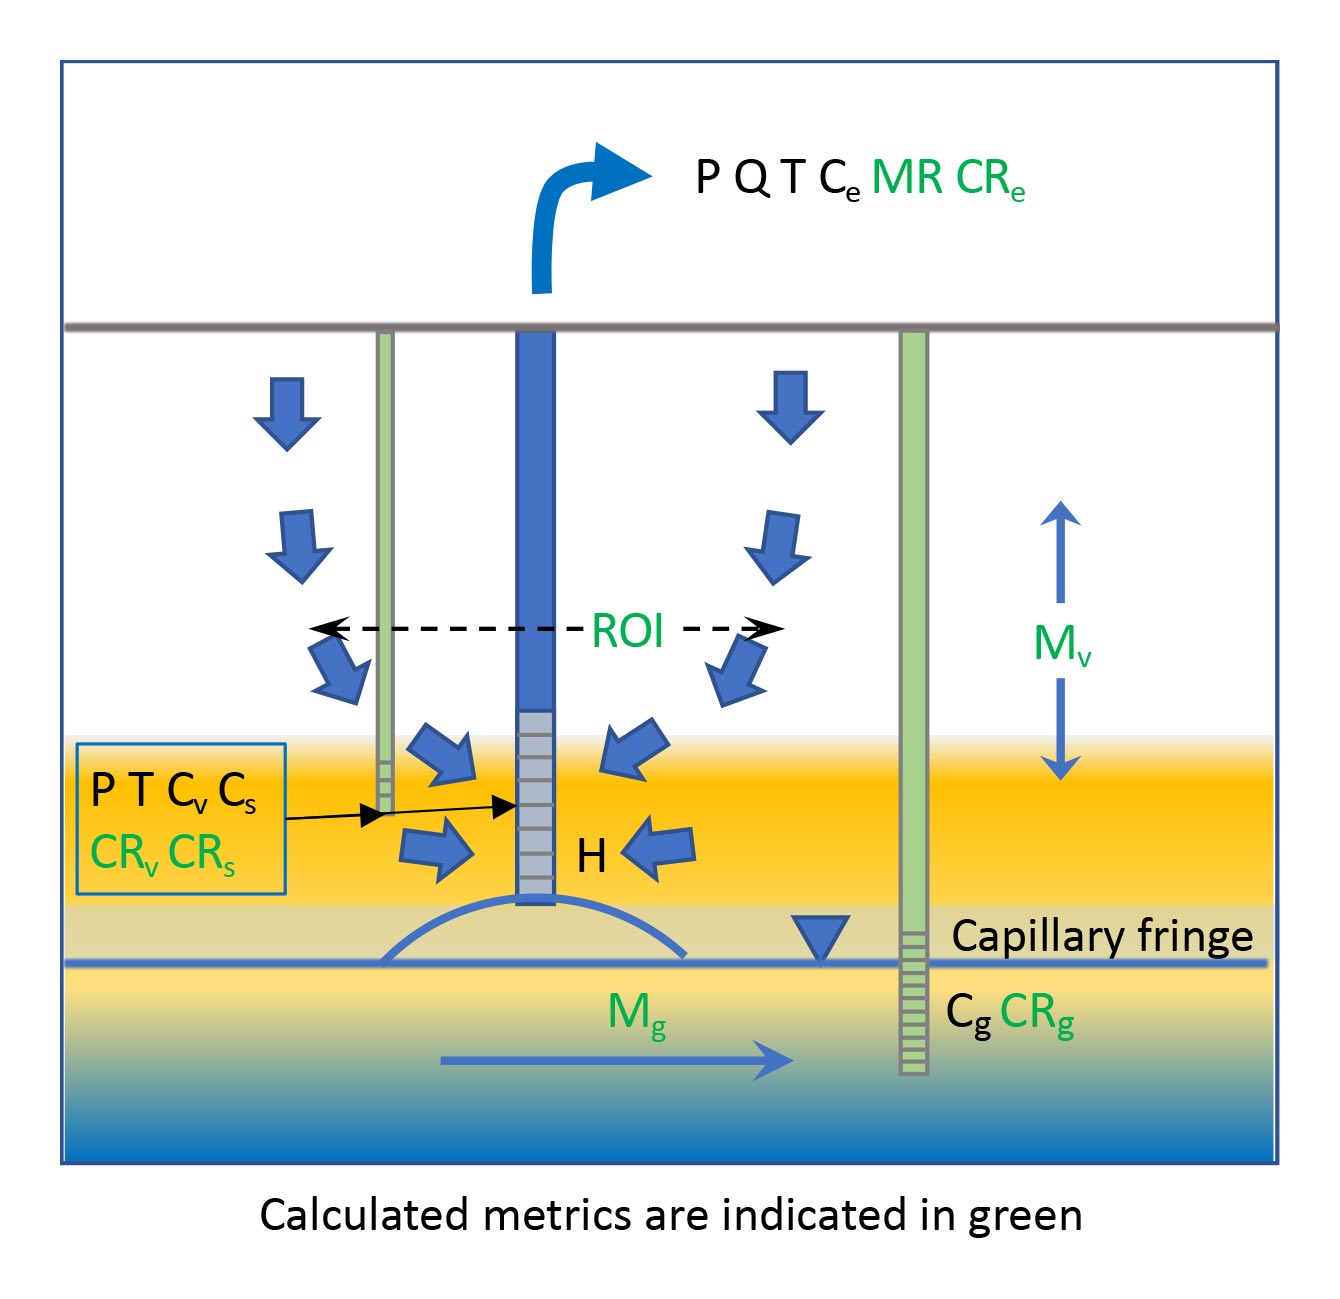
Performance Metrics
- Cs = Soil concentration
- Cg = Groundwater concentration
- Cv = Soil vapor concentration
- CRs CRv CRg = Concentration ratios
- Mg = Groundwater mass flux or discharge
- Mv = Soil vapor mass flux or discharge
- Ce = Soil gas concentration in extracted gas
- Q = Flow rate
- P = Pressure
- T = Temperature (optional)
- H = Water level mounding
- MR = Mass removal rate (Q x Ce)
- CRe = Concentration ratios
- ROI = radius of influence
System Metrics
- Soil gas concentrations (VOCs of concern, TPH (e.g., C5-12) and fixed gases, oxygen – O2, carbon dioxide – CO2, and methane – CH4) at individual extraction wells and the system header
- Soil gas concentration ratios calculated from compositional analysis at extraction wells and the system header
- Gas flow rates at individual extraction wells and the system header
- Hydrocarbon mass removal rates calculated from gas flow and soil gas concentrations (gas flow multiplied by concentration) at individual extraction wells and the system header
- Pressures at individual extraction wells, the system header, and monitoring points
- Fluid level mounding at extraction wells when system is on as system performance may be reduced when there is mounding
- Air treatment metrics such as consumption of thermal oxidizer assist gas
- Soil gas temperatures at individual extraction wells and the system header (in gas) and/or ground temperatures using appropriately located thermistors (optional)
Subsurface Metrics
- Concentrations in soil, groundwater or LNAPL, and soil vapor (Table 1)
- Mass flux or discharge in groundwater and/or soil vapor
Soil gas concentration data are commonly used to gauge performance of an SVE system and overall site risk. The concentration data can be evaluated for individual chemicals or as ratios (e.g., preferential attenuation of lighter molecular weight petroleum hydrocarbons (PHCs) can indicate reduced risk – ITRC 2009b). Measurements of concentrations of fixed gases associated with hydrocarbon biodegradation (O2, CO2, and CH4) can be used to distinguish the relative contributions of biodegradation and volatilization to PHC mass removal. Compound specific isotope analysis (CSIA) is an additional line of evidence that may be considered to distinguish between biodegradation and volatilization (see Bioventing Factsheet). Soil gas characterization techniques used for estimating mass removal are provided in Appendix I.
Mass Flux or Discharge vs. Concentration
- mass flux: mass per unit area per time (e.g., kg/m2-day)
- mass discharge: mass per time; crossing plane of interest (e.g., kg/day); and
- mass loading: mass per time at intersection of plume and receptor (e.g., kg/day).
- time to achieve objectives
- cost (e.g., $/kg PHC removed)
- greenhouse gas emissions (GHG) or other quantifiable sustainability metrics (e.g., kg CO2 emissions/kg HC removed)
Additional information on SVE system monitoring, optimization, and performance metrics is provided in Appendix II, Appendix III and Appendix IV, respectively.
Transition Thresholds
The decision to terminate SVE requires confidence (multiple lines of evidence – MLE) that rates of PHC attenuation are sufficient to meet remedial objectives after the system has been turned off. Estimates of mass discharge and mass loading from monitoring data, rebound tests, and predictive modeling (Brusseau et al. 2010; Truex et al. 2013; US EPA 2018) can be useful in this regard (see call-out box).
Modeling Tools for Mass Flux and Mass Discharge Estimation
Changes in chemical concentrations over space (e.g., along transects) or over time at fixed locations (e.g., sampling or extraction point), may be used to estimate groundwater mass flux and discharge using the GSI Mass Flux Toolkit. The SVEET2 model quantifies the mass discharge and impact of remaining vadose zone contaminant sources on groundwater, and integrates the assessment outcomes into a decision logic approach to address SVE optimization, transition, and closure decisions. The SVEET2 software provides a parallel approach to estimating the impacts of a vadose zone source on soil gas concentrations and vapor intrusion into a building. The BIO-SVE model simulates mass reduction through volatilization and biodegradation following the method in Johnson et al. 1990a,b. (may require virtual computer to run because of out-dated software).
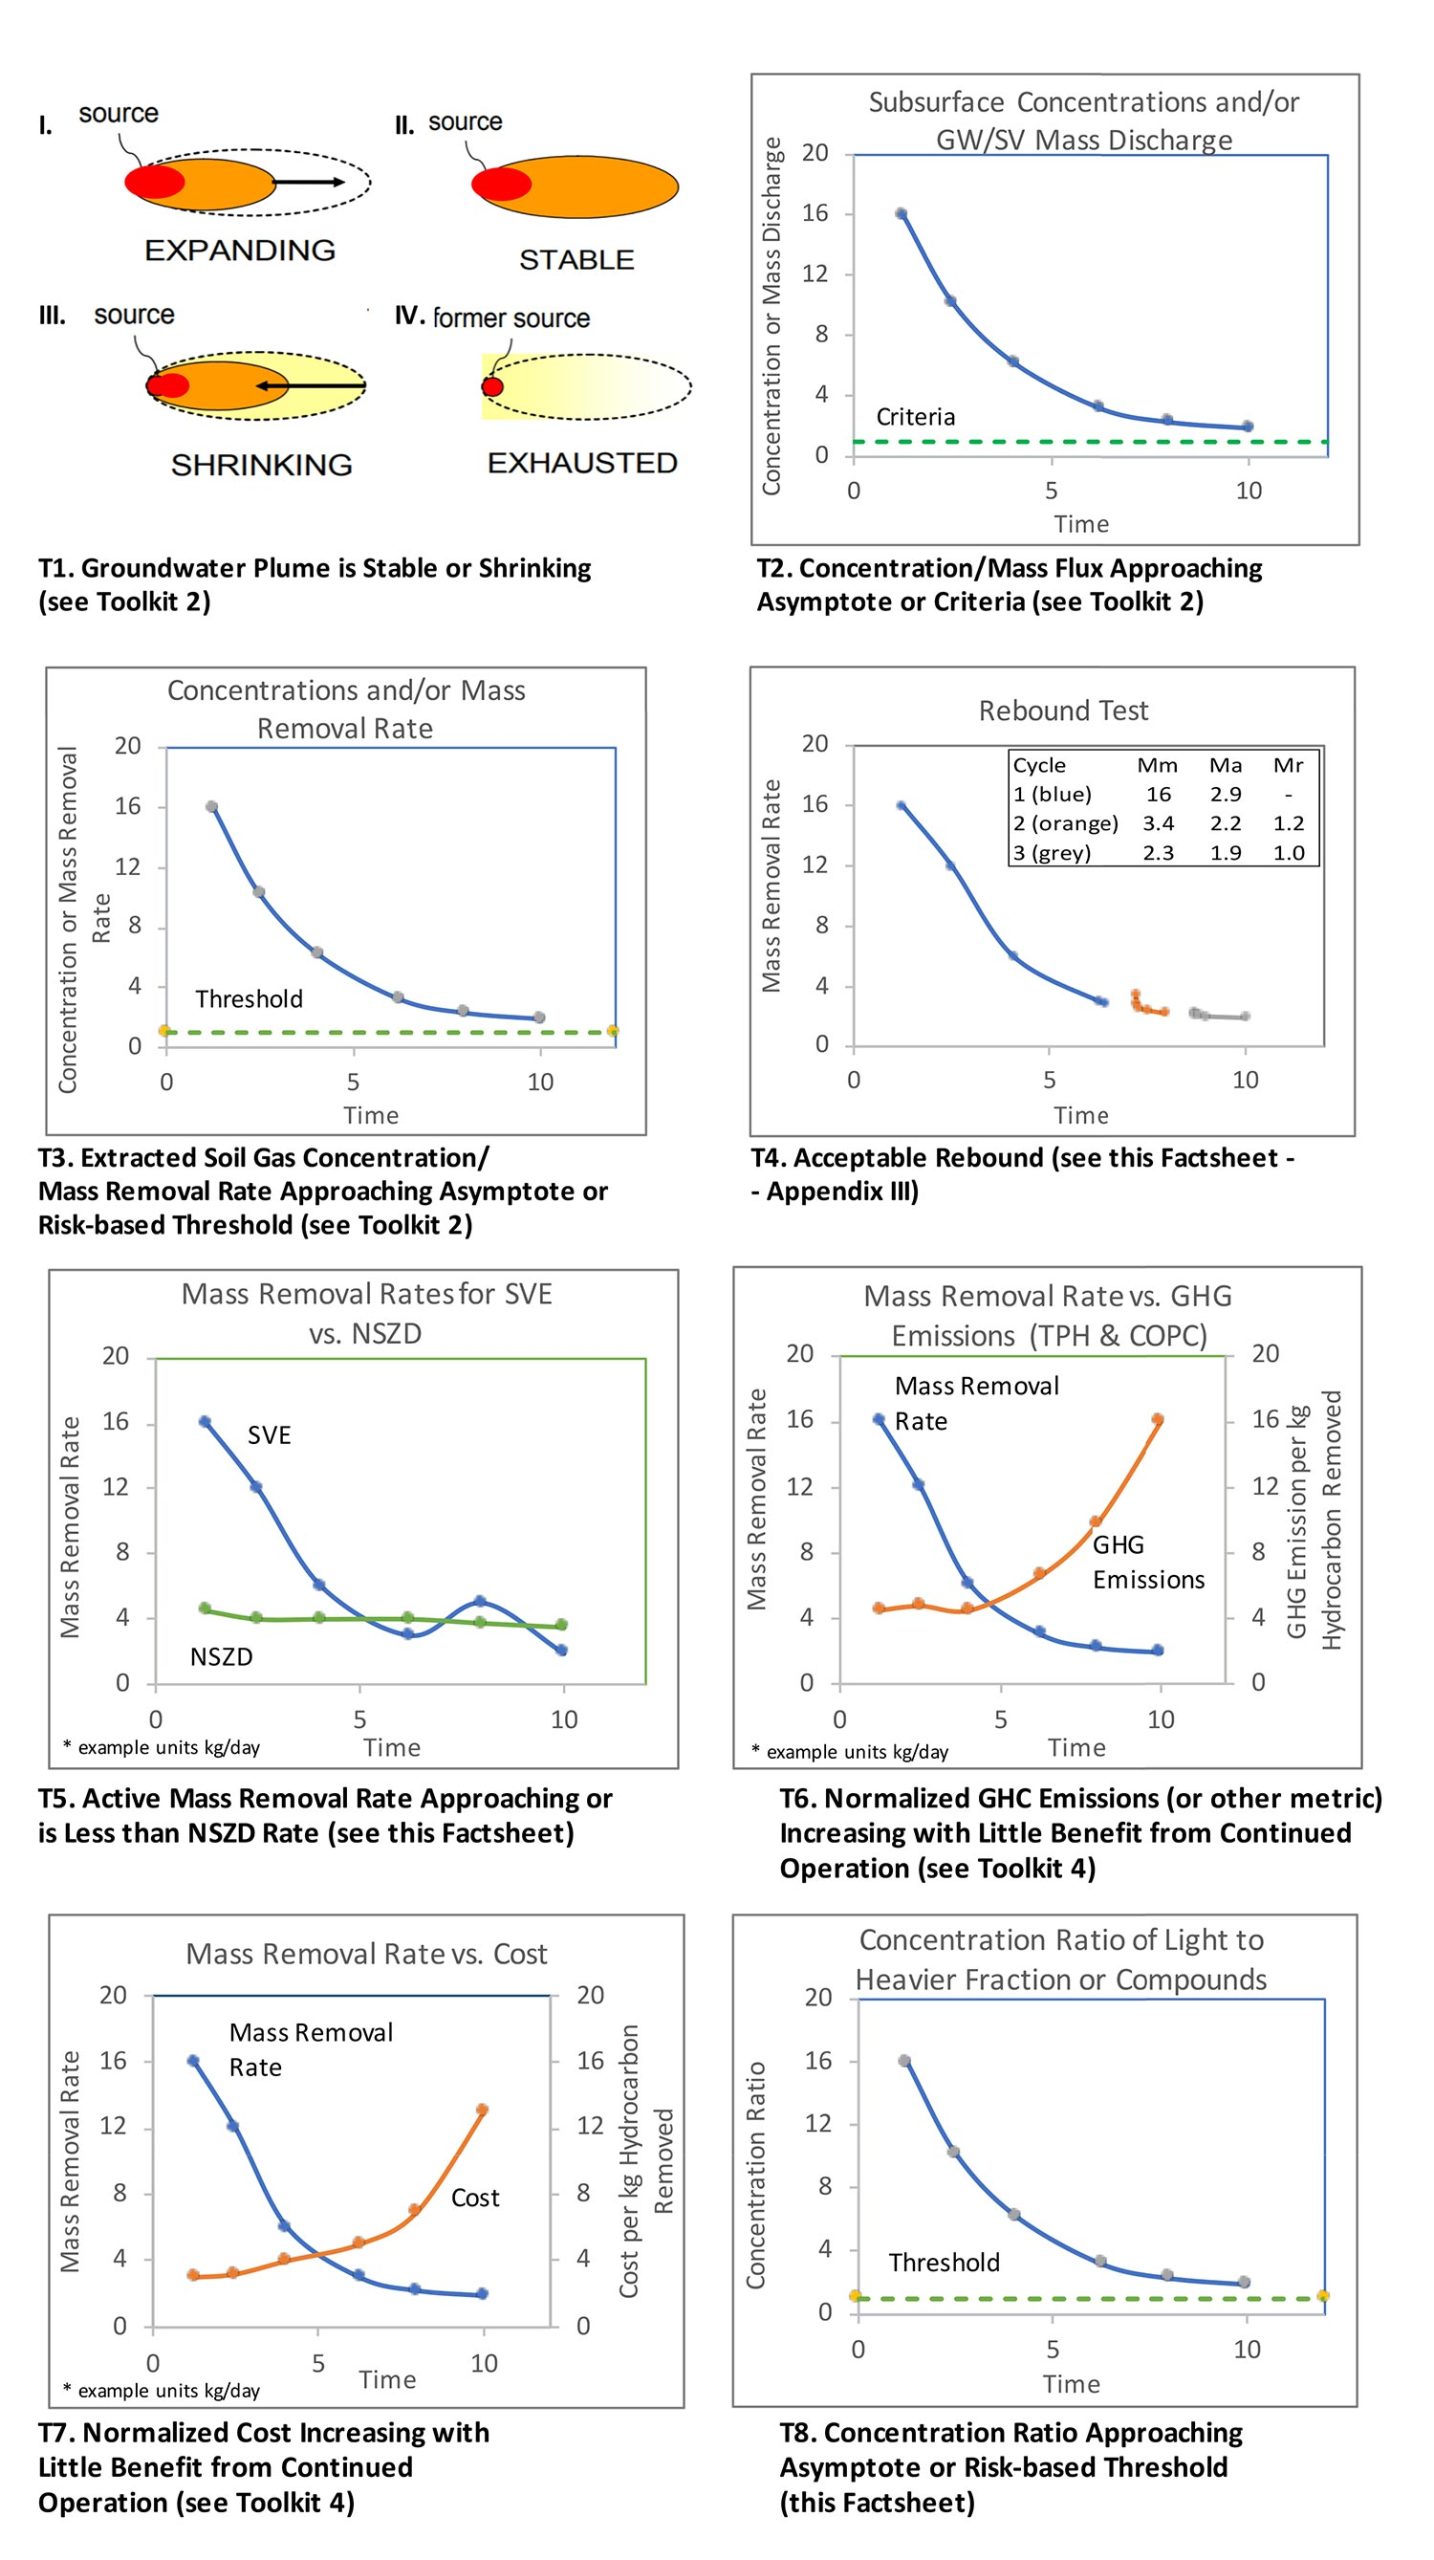
T1. Stable or shrinking dissolved groundwater and soil vapor plumes.
T2. Subsurface concentrations and/or mass flux, mass discharge or mass loading less than or approaching defined risk-based or regulatory criteria (i.e., where MNA is expected to “finish the job”)1.
T3. System (extracted soil gas or influent) concentrations or mass removal rates approaching low levels and/or total mass removal approaching asymptotic levels or a reasonable threshold percentage (e.g., 80 or 90%) of the total estimated mass (e.g., Johnson et al. 1990a), and/or risk-based thresholds.
T4. Minimal or acceptable rebound (i.e., stability) in groundwater or vapor concentrations based on quantitative analysis of plume concentrations, mass discharge or mass loading.
T5. SVE mass removal rates similar to natural source zone depletion (NSZD) or natural attenuation rates obtained from the baseline assessment2 for either total PHC or individual COCs. The mass removal rates can be compared based on an area normalized rate in units of mass per time-area or for a representative LNAPL-impacted area or “site” in units of mass per time.
T6. Decreasing mass removal rates and corresponding GHG emissions (or other sustainability indicators) per mass of contaminant removed that are increasing exponentially.
T7. Decreasing mass removal rates and corresponding costs per mass of contaminant removed that are increasing exponentially.
T8. Preferential loss of lighter molecular weight PHCs (e.g., risk-drivers such as benzene) from groundwater or LNAPL and/or ratios of light to heavy molecular weight PHCs that have reached asymptotic levels and/or risk-based thresholds.3
The transition thresholds should be selected depending on site conditions and project requirements. While a comprehensive list of thresholds is provided to provide flexibility in options, typically only a smaller subset of thresholds or in some cases a single primary threshold may be warranted. Depending on the site, a MLE approach can improve confidence and acceptance of the transition, and often can be achieved through analysis of readily available data collected during the remediation life cycle.
When evaluating thresholds for transition of SVE technology to natural attenuation, passive remediation, or “no further action”, it is important to quantify the mass removal through different mechanisms. Consequently, in many cases, it will be appropriate to quantify the mass removal through SVE, through bioventing (see Bioventing Factsheet), and through natural attenuation. Because SVE targets compositional change, typically the focus is on COC mass removal.
Remediation Validation
| Metric | Applicable (Y/N)? | Locations/Frequency |
|---|---|---|
| Performance Metrics | ||
| System | ||
| P1. Soil gas concentrations* at extraction wells and system header | ||
| P2. Soil gas compositional analysis and concentration ratios at extraction wells and system header | ||
| P3. Air flow rates at extraction wells and system header | ||
| P4. Mass removal rates at extraction wells and system header | ||
| P5. Pressures at extraction wells and system header and monitoring points | ||
| P6. Fluid level mounding at extraction wells | ||
| P7. Air treatment metrics such as consumption of thermal oxidizer assist gas | ||
| P8. Temperatures at extraction wells and system header (in gas) and/or in-ground (optional) | ||
| Subsurface | ||
| P9. Concentrations in soil, groundwater, soil gas and/or LNAPL * at monitoring locations | ||
| P10. Groundwater and soil vapor mass flux and mass discharge | ||
| Transition Thresholds | ||
| T1. Stable or shrinking groundwater and soil vapor plumes (consider statistical tools such as Mann-Kendall, regression and spaciotemporal plume or mass analytics) | ||
| T2. Subsurface concentrations and mass flux, discharge or loading are at or approaching criteria | ||
| T3. System concentrations/mass removal rates approaching low or asymptotic levels | ||
| T4. Minimal or acceptable rebound | ||
| T5. Mass removal rates during SVE operation approaching natural attenuation (i.e., NSZD) rates | ||
| T6. Decreasing mass removal rates while normalized GHG emissions are increasing | ||
| T7. Decreasing mass removal rates while normalized costs are increasing | ||
| T8. Compositional change indicating decreasing light fraction as indicated by concentration ratios | ||
Table 1 - Summary of Example Performance Metrics and Transition Thresholds (select applicable metrics and thresholds as needed)
Appendix I – SVE Technology Description
Overview of Technology
SVE is the application of a vacuum to unsaturated (vadose zone) soils to induce advective soil vapor flow toward extraction wells and remove volatile and some semi-volatile contaminants from soil. Once removed from the soil, volatile organic compounds (VOCs) are typically removed or destroyed using an aboveground treatment process such as granular activated carbon, or catalytic or thermal oxidation (US EPA 2006). SVE is primarily a composition-based remedy because higher volatility VOCs are removed at greater rates than lower volatility VOCs. Consequently, SVE can be used to target remediation of lighter COCs such as benzene.4
The phase change and mass removal typically decrease during the treatment life cycle. During early stages of remediation, the primary mass removal is from air pathways of low resistance (higher permeability soils), where chemicals in adsorbed phase or non-aqueous phase liquids (NAPL) partition into the moving air. Contaminants in lower permeability soils will not be removed by advection because soil vapors will preferentially flow through higher permeability soils. When the mass in higher permeability soils becomes mostly depleted, the rate of mass removal may approach a low value or cumulative mass recovery may approach an asymptotic value. This is because contaminants in lower permeability silts and clays and within the capillary fringe, if present, must desorb and diffuse into an advective flow path before they can be removed by the SVE system. If the rate of diffusion is slow, the time duration for removing VOCs may be significantly extended (US EPA 1991). US EPA (2018) describes a two-compartment model (coarse- and fine-grained) for prediction of concentrations and clean-up times when there are mass transfer limitations resulting from slow diffusive transport in fine-grained soil layers.
The addition of air through SVE may result in enhanced aerobic biodegradation and consequently SVE is closely related to bioventing (refer to Bioventing Factsheet). Because there is often contamination at or below the water table, remediation through air sparging will often be an additional component to the SVE system.
Site Conditions Conducive to SVE
Site Conditions most conducive to effective SVE Performance
- relatively homogeneous, permeable soils (i.e., coarser-grained and lower moisture content)
- relatively small capillary fringe thickness
- VOCs located above the capillary fringe
- low soil organic carbon content
- volatile contaminants
Generalized Site Types for Applicability of SVE
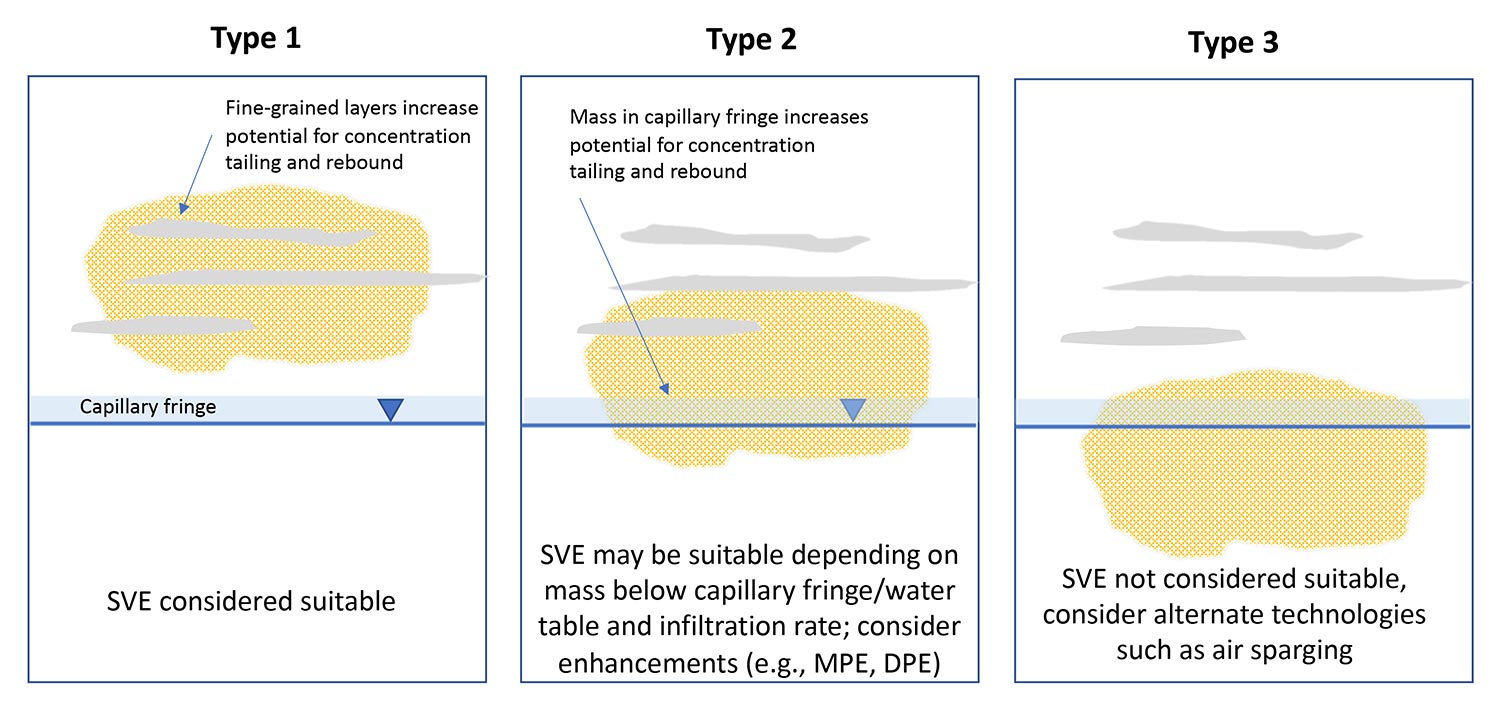
- Type 1: Contamination is primarily located in the vadose zone with low-level concentrations of dissolved VOCs in groundwater. Mass transfer is from the vadose zone to groundwater and from the vadose zone to ambient air.
- Type 2: Contamination is located in the vadose zone and saturated soil zone. Mass transfer may be either from the vadose zone to groundwater or from groundwater to the vadose zone. Mass transfer from the vadose zone to ambient air will also occur.
- Type 3: Contamination is primarily in the saturated soil zone or trapped in a thick capillary fringe. Mass transfer is primarily upward from groundwater to the vadose zone.
SVE is best suited to Type 1 sites but may also be considered for Type 2 sites. Typically, enhancements to SVE that target the saturated soil zone such as multi-phase extraction (MPE), dual-phase extraction (DPE) or air sparging are required for many Type 2 sites and all Type 3 sites. The site type may vary seasonally because of water table fluctuations and consequently an effective strategy may be to design the system to operate in different ways (e.g., SVE vs DPE vs MPE) depending on fluid level.
SVE Design
SVE design guidance is provided in Johnson and Ettinger (1994), USACE (2002), CAL EPA (2010), Truex et al. (2013) and US EPA (2018). A full-scale SVE system may be designed based on pilot test data and modeling. A design solely based on measured or estimated soil vacuums is not recommended (e.g., assuming effective radius of influence solely based on vacuum equal to 1% of extraction well vacuum). There are several modeling approaches of varying complexity that may be considered:
- Simplified venting models involving calculation of cleanup times from estimated air flow rates for a defined geometry of impacted soil and either partitioning models (Johnson et al. 2000a,b) or empirical estimates of typical pore volume flushings needed to meet cleanup goals (e.g., 1000 to 1500 in USACE 2002).
- Modeling approaches based on estimation of spatial distribution of soil pore air velocities (DiGiulio and Varadhan 2001; USACE 2002).
- Semi-analytical approaches based on measured SVE well extraction rates, remediation timeframe and estimates of subsurface contaminant mass along with empirical estimates of volatilization and mass transfer efficiency (Johnson and Ettinger 1994; CAL EPA 2010).
The SVE design should consider the use of dipole wells, defined as a well pair where air injection occurs at one well under pressure (while maintaining overall vapor control) or passively at atmospheric pressure, and extraction occurs at the other well (USACE 2002), or operating schemes with multiple extraction or injection wells, to optimize air flow rates and clean-up times. Flexibility in design should be considered so that wells can be operated either in pressure or vacuum modes. The use of dipole wells is particularly important for sites with confining layers, e.g., fine-grained soil overlying coarse-grained soil layers. Cycling the operation of multiple wells will also reduce stagnation zones. Because it is more difficult to retrofit and optimize a system after construction, these designs should be considered as part of the initial design phase. Both vertical and horizontal wells may be considered (US EPA 2018).
Available model codes and tools include 1) SVE-3D, 2) Bio-SVE and 3) SVEET2 models for estimation of impacts to groundwater and buildings through volatilization and leaching (see references previously provided). US EPA (2018) review the use of models to predict residual concentrations and mass transfer to groundwater after SVE ceases.
SVE Soil Gas Monitoring
Soil gas concentrations consisting either of periodic readings or continuous measurements are key performance data for estimating mass recovery rates and compositional change for comparison to transition thresholds and to support system termination. Soil gas concentration ratios (compositional data) also provide useful data on the progress of remediation and are a useful diagnostic parameter to support optimization and transition. A change in composition where lighter molecular weight PHCs are preferentially removed (e.g., benzene) resulting in higher proportion of heavier molecular weight PHCs remaining generally indicates reduced risk (ITRC 2009b). Compositional change also results from varying biodegradation rates.
Soil gas PHC concentrations should be measured using hand-held photoionization or flame ionization detectors (PID or FID) and fixed gases (O2, CO2, CH4) can be measured using hand-held infrared and galvanic cell type detectors. Consideration should be given to use of continuous PHC and/or fixed gas monitors combined with telemetry to reduce site visits and exposure time. Continuous monitoring of CO2 measurements and radiocarbon analyses may be used to estimate mass recovery through PHC biodegradation as radiocarbon enables PHC degradation to be distinguished from natural organic degradation (see Bioventing Factsheet and Natural Attenuation Factsheet).
Select samples collected at given time intervals should typically be analyzed using laboratory methods to develop a correlation with field data. Soil gas or SVE system influent or effluent collected in canisters or gas bags may be analyzed for VOCs according to US EPA Method TO-15 or modified US EPA Method 8260 analyses (sorbent tubes by US EPA TO-17 may also be an acceptable alternative). Additionally, PHC carbon range analysis may be conducted using US EPA Method TO-3 or US EPA Method 18. Samples are typically analyzed for fixed gases according to method ASTM D1946.
Appendix II - Additional Performance Measurements and Diagnostics
This appendix describes performance measurements and diagnostic tests that can be used to assess the “strength” of remaining LNAPL source zones. These data are used to optimize SVE remediation to support transition from active to passive remediation and include:
- Mass removal rate: The rates from individual extraction wells can be used to identify soil zones or areas with relatively greater mass remaining in the subsurface. Johnson et al. (1990a) provide practical methods to quantify mass removal rates from wells and remediation times.
- Temporal extraction-concentration analysis: Temporal extraction-concentration data that show tailing indicates rate-limited mass transfer (DiGiulio et al. 1998). Extrapolation of concentration trends may be used to estimate the time scale over which mass flux or discharge may persist from the zone influenced by the SVE system. A sharp decline in the concentration of the heaviest component in VOCs measured may indicate complete volatilization of the LNAPL (Ng et al. 1999).
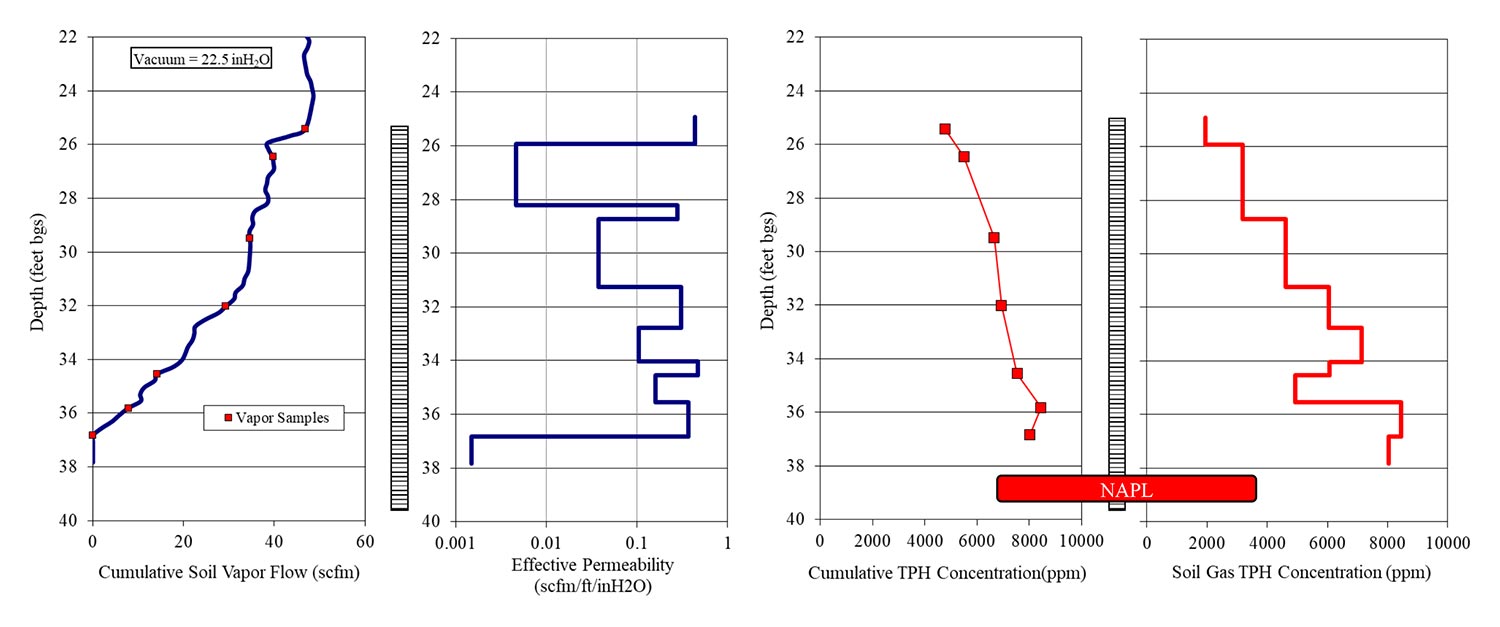
- Flow/concentration profiling: If the extraction wells at a site have long screens that bracket the source zone addressed by the SVE system, then profiling of in-well flow velocities and contaminant concentrations under active extraction (e.g., the Pneulog® system by Praxis Environmental Technologies, Inc., Burlingame, California [Praxis 2000]) can provide information on the vertical distribution of remaining contamination sources, soil-air permeability and soil zones subject to mass transfer limitations (Figure II-1). Site characterization tools such as a membrane interface probe may be used to obtain vertical profiles of VOC concentrations and soil type.
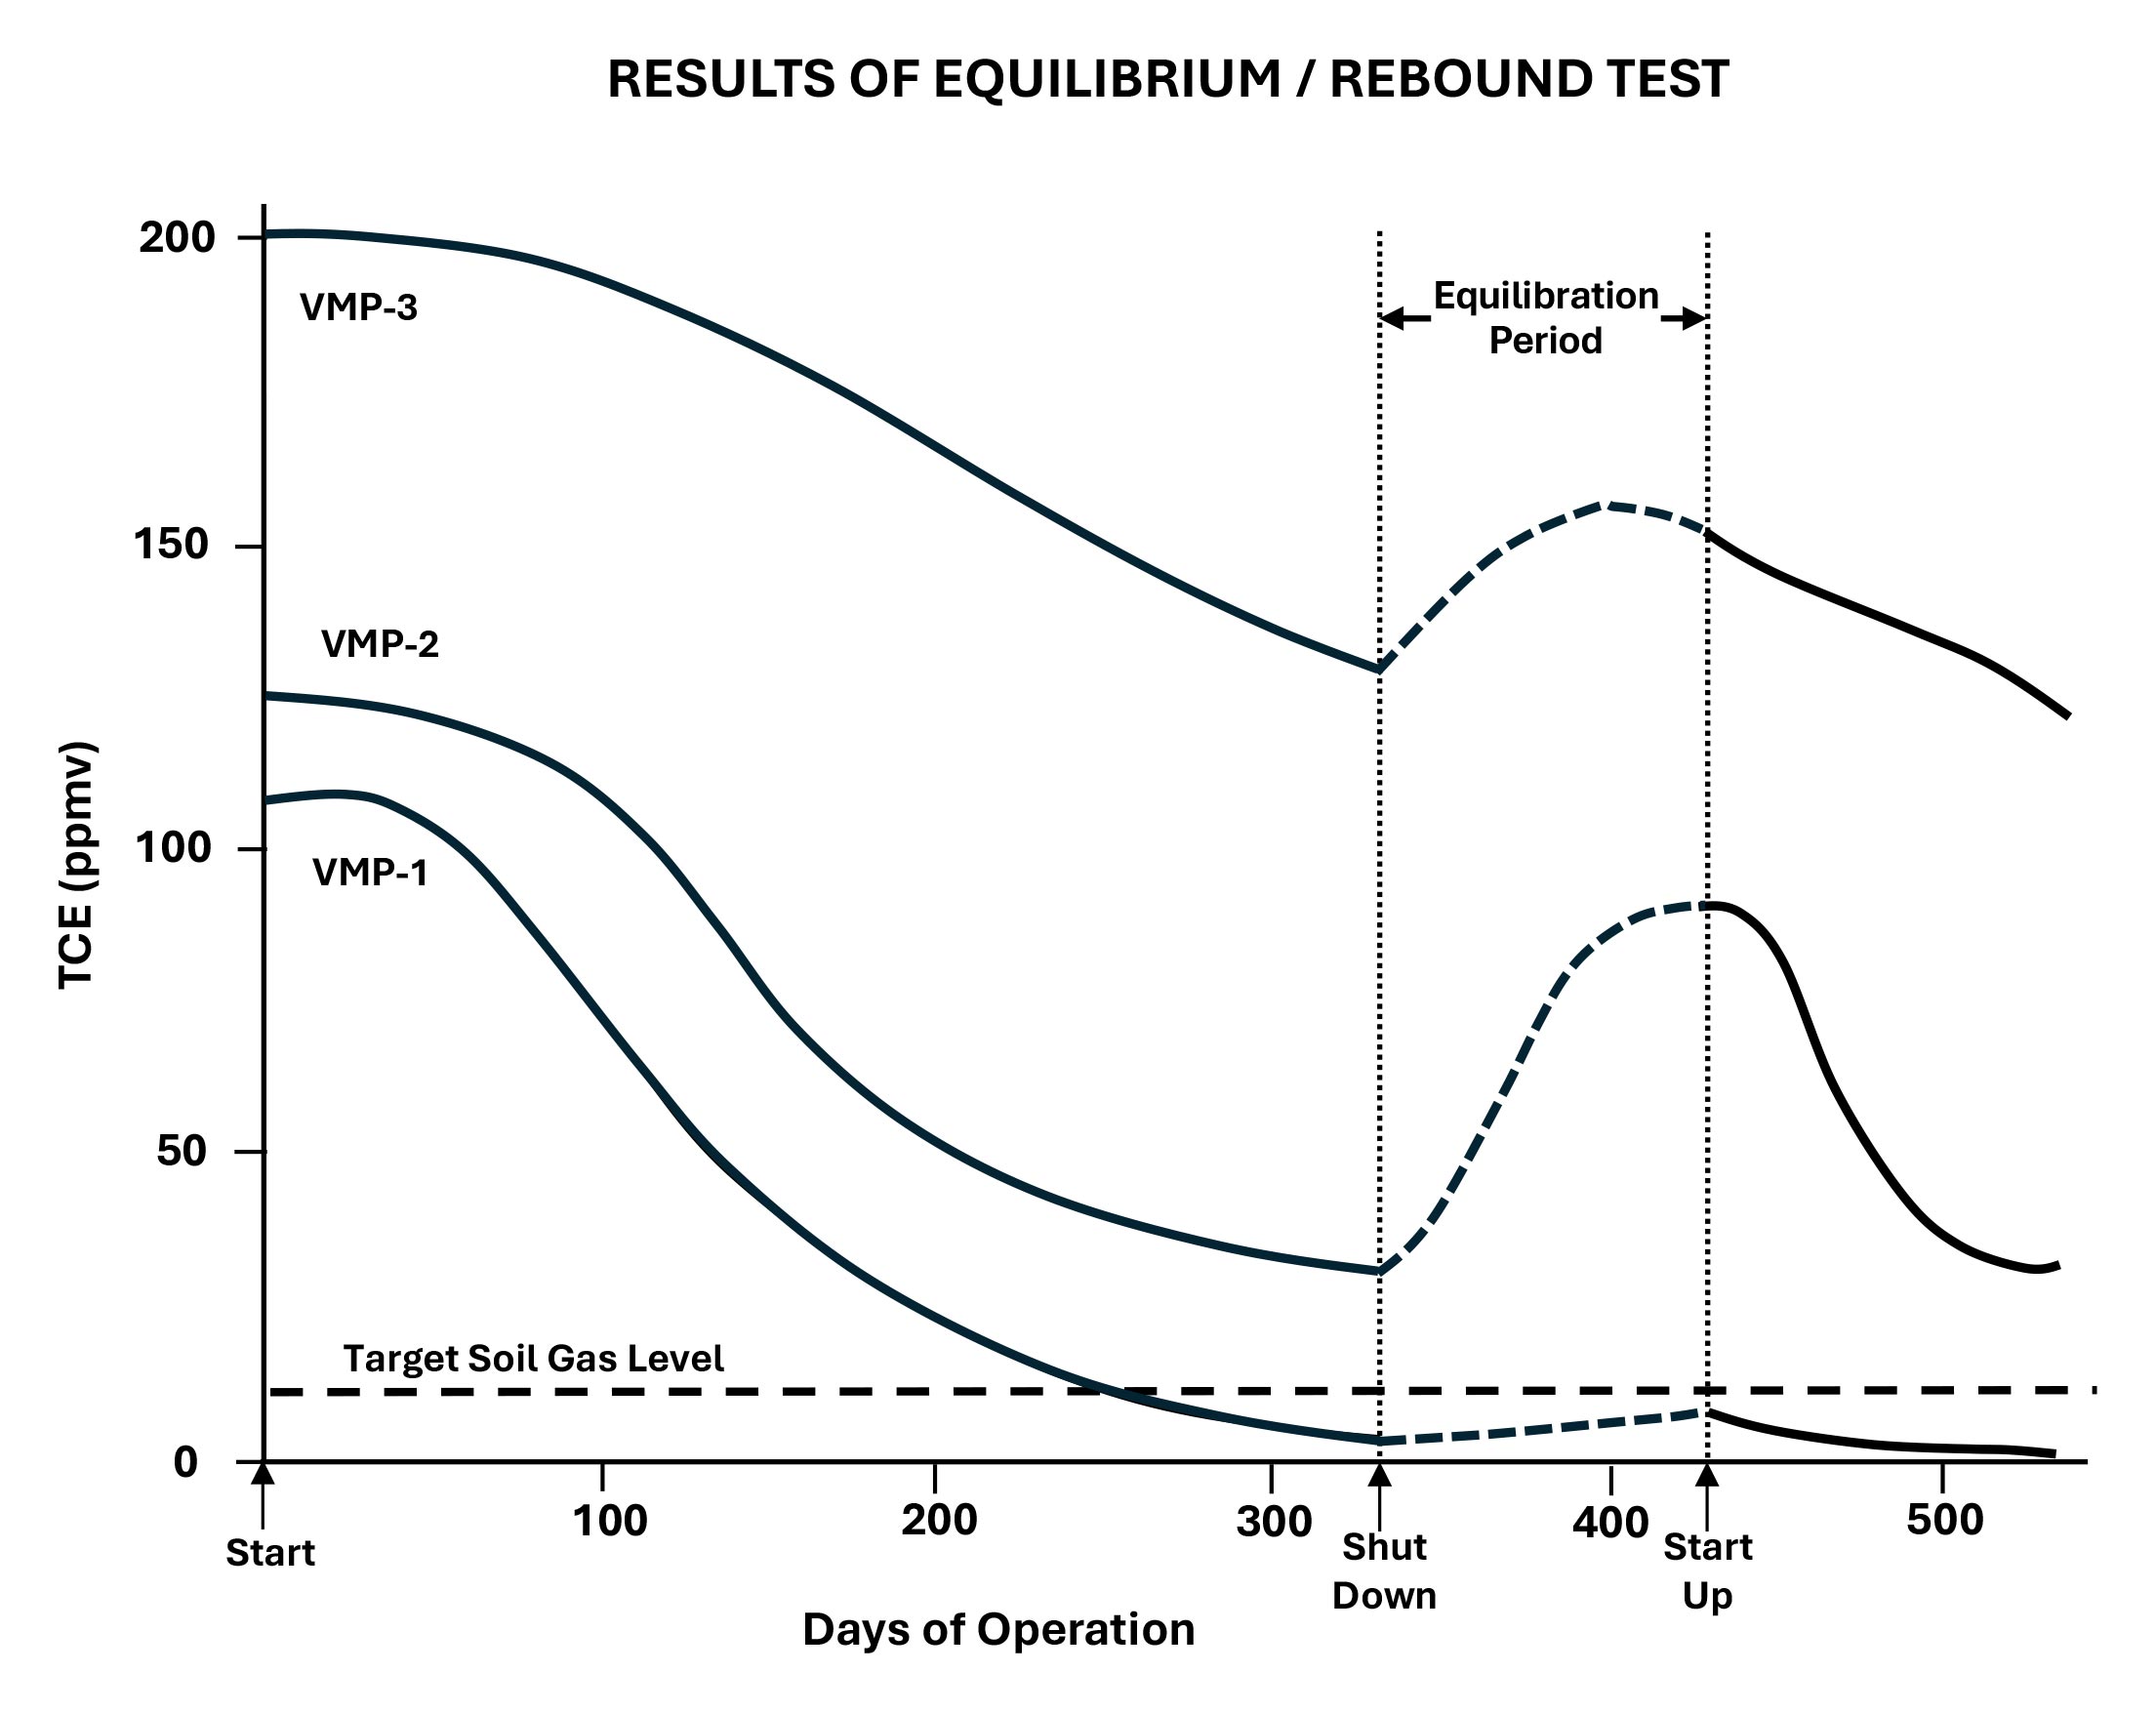
- Rebound tests: Rebound tests are conducted when VOC concentrations and mass removal rates in extraction wells approach low or asymptotic levels. The tests involve turning the system off and measuring concentration rebound while the system is off and concentrations and mass recovery rates when the system is initially turned back on. Minimal concentration and mass recovery rebound supports termination of active remediation. Higher concentration and mass recovery rates indicate the presence of greater remaining mass and possible mass transfer limitations from lower permeability zones and/or capillary fringe and need for continued system operation or optimization or consideration of an alternate system. Data from individual wells can provide useful optimization information on zones requiring additional treatment. The timeframe for rebound assessment is a site-specific determination but may be up to a year (CAL EPA 2010). Quantitative methods are described in Appendix III.
Appendix III - Quantitative Methods for Analysis of Rebound Tests
The key assumptions are:
- At the start of the rebound test when the system is turned on, vapors extracted during the removal of the first pore volume of gas equivalent primarily represents the mass present in the permeable zones.
- There is minimal contaminant mass present in the permeable zones just before the start of the rebound period when the system is turned off.
- The contaminant mass removed during the start of the rebound test represents diffusive mass discharge from the lower permeability zones during the rebound period under natural concentration and pressure gradients.

The mass removed in the first pore volume, MPV, after the system is turned on is normalized by the length of the rebound time period to calculate the rate of mass rebound, Mr, considered to represent diffusive mass discharge from low permeability zones under natural conditions, as follows.

Additional parameters used in the analysis are:
Maximum mass removal rate = Mm = Q x C (beginning of cycle)
Asymptotic mass removal rate = Ma = Q x C (toward end of cycle)
The analysis involves evaluation of two pairs of data, Mm and Ma, and Ma and Mr. Systems that are approaching the end of their useful operational life are where Mm approaches Ma, and where Ma approaches Mr as mass discharge under natural conditions will be typically less than under operational conditions.
US AFCEE (2001) provides information on the optimization of SVE systems and rebound testing. One example from the US AFCEE (2001) guidance is re-produced as Figure III-1. The data is interpreted as follows: VMP-3 is located in a high contamination, low permeability zone, while at VWMP-2, the rapid decline and then significant (>50 %) rebound approaching initial concentrations indicates this probe is located in a more permeable zone adjacent to a highly contaminated, low permeability zone where the release of VOCs is controlled by diffusive processes. VMP-1 is in an area with low sorbed VOC concentrations. Typical timeframes for soil gas concentrations to reach quasi-equilibrium conditions in rebound tests are weeks in coarse-grained soils to months in more complex layered deposits of fine- and coarse-grained soils (US AFCEE 2001).
Appendix IV - Optimization of SVE Systems
Optimization activities to improve performance and sustainability of SVE systems can include:
- Rebalancing of air flow to increase flow rates in zones with highest mass removal rates.
- Adding passive/active air injection wells in areas where higher air flow is needed (USACE 2002). Optimization design can be supported through use of numerical models (e.g., see historical example using AIR3D in Sawyer and Kamakoti (1998); note there are limited published examples using newer models).
- Adding wells with screens that target remaining areas of higher mass including lower permeability soil zones.
- Reduction of total air flow rate to balance mass discharge or the diffusive mass transfer rate to wells to achieve lower operational costs.
- Pulsed operation of the SVE system operation such that the same mass recovery is achieved at lower operational cost.
- Hydraulic or pneumatic fracturing to enhance remediation by increasing the effective (interconnected) porosity of subsurface materials, which may be particularly effective at sites with low-permeability soil and geologic media.
- Conversion of the SVE system to a lower-energy bioventing system that could, for example, be operated with pulsed air injection (see Bioventing Factsheet).
- As a polishing step, converting wells to a passive system through installation of one-way check valves to promote barometric pumping (ESTCP 2006). Because of lower air flow rates this technology is more applicable to bioventing (see Bioventing Factsheet).