Appendix I – SVE Technology Description
ESTCP (2002) Air Sparging Design Paradigm
- Site characterization and development of site conceptual model
- Preliminary feasibility assessment
- Pilot testing
- Design
- Monitoring
The pilot testing is divided into two approaches, 1) standard design approach and 2) site-specific design approach. For each of these two approaches there are default designs and recommended monitoring. The flow chart for air sparging design including pilot testing is shown in Figure B-1.
The standard design approach recommends the following data collection: injection pressure versus flow rate test, transient pressure response test, dissolved oxygen measurements, helium tracer test and soil gas sampling. Based on this data set, injection wells based on 15 ft centers and 20 ft3/min injection rate are recommended. The site-specific design approach recommends the standard methods plus sulphur hexafluoride tracer test to assess air distribution more accurately.
Overview of Technology
The phase change and mass removal typically decrease during the treatment life cycle. During early stages of remediation, the primary mass removal is from air pathways of low resistance (higher permeability soils), where chemicals in adsorbed phase or non-aqueous phase liquids (NAPL) partition into the moving air. Contaminants in lower permeability soils will not be removed by advection because soil vapors will preferentially flow through higher permeability soils. When the mass in higher permeability soils becomes mostly depleted, the rate of mass removal may approach a low value or cumulative mass recovery may approach an asymptotic value. This is because contaminants in lower permeability silts and clays and within the capillary fringe, if present, must desorb and diffuse into an advective flow path before they can be removed by the SVE system. If the rate of diffusion is slow, the time duration for removing VOCs may be significantly extended (US EPA 1991). US EPA (2018) describes a two-compartment model (coarse- and fine-grained) for prediction of concentrations and clean-up times when there are mass transfer limitations resulting from slow diffusive transport in fine-grained soil layers.
The addition of air through SVE may result in enhanced aerobic biodegradation and consequently SVE is closely related to bioventing (refer to Bioventing Factsheet). Because there is often contamination at or below the water table, remediation through air sparging will often be an additional component to the SVE system.
Exit Strategy Toolkit
Natural Attenuation Factsheet
Natural Attenuation (NA)
Natural Source Zone Depletion (NSZD)
- determining the need for active remediation based on whether rates of NA are sufficient to 1) limit the migration of hydrocarbons to potential receptors (e.g., drinking water wells, current/future buildings overlying the contamination) and/or
- inform the optimization or termination of active remediation. The use of NA rates in remedial decision making should be agreed upfront with key stakeholders prior to the onset of active remediation.
2) achieve remedial objectives (saturation- or composition-based) within a reasonable timeline;
Monitored Natural Attenuation (MNA)
This factsheet aims to address some of the commonly cited challenges in estimating the rates, such as:
- Unfamiliarity with the methods and lack of consistent standards;
- Uncertainty associated with the measurements;
- Lack of regulatory guidance on application of the estimated rates;
- Current remedies deemed effective; and
- Budgetary constraints.
The purpose of this factsheet is to highlight the various tools available to help quantify and analyze NA rates. Their uptake and a multiple-lines-of-evidence (MLE) approach can help to avoid unnecessary, non-sustainable active remediation.
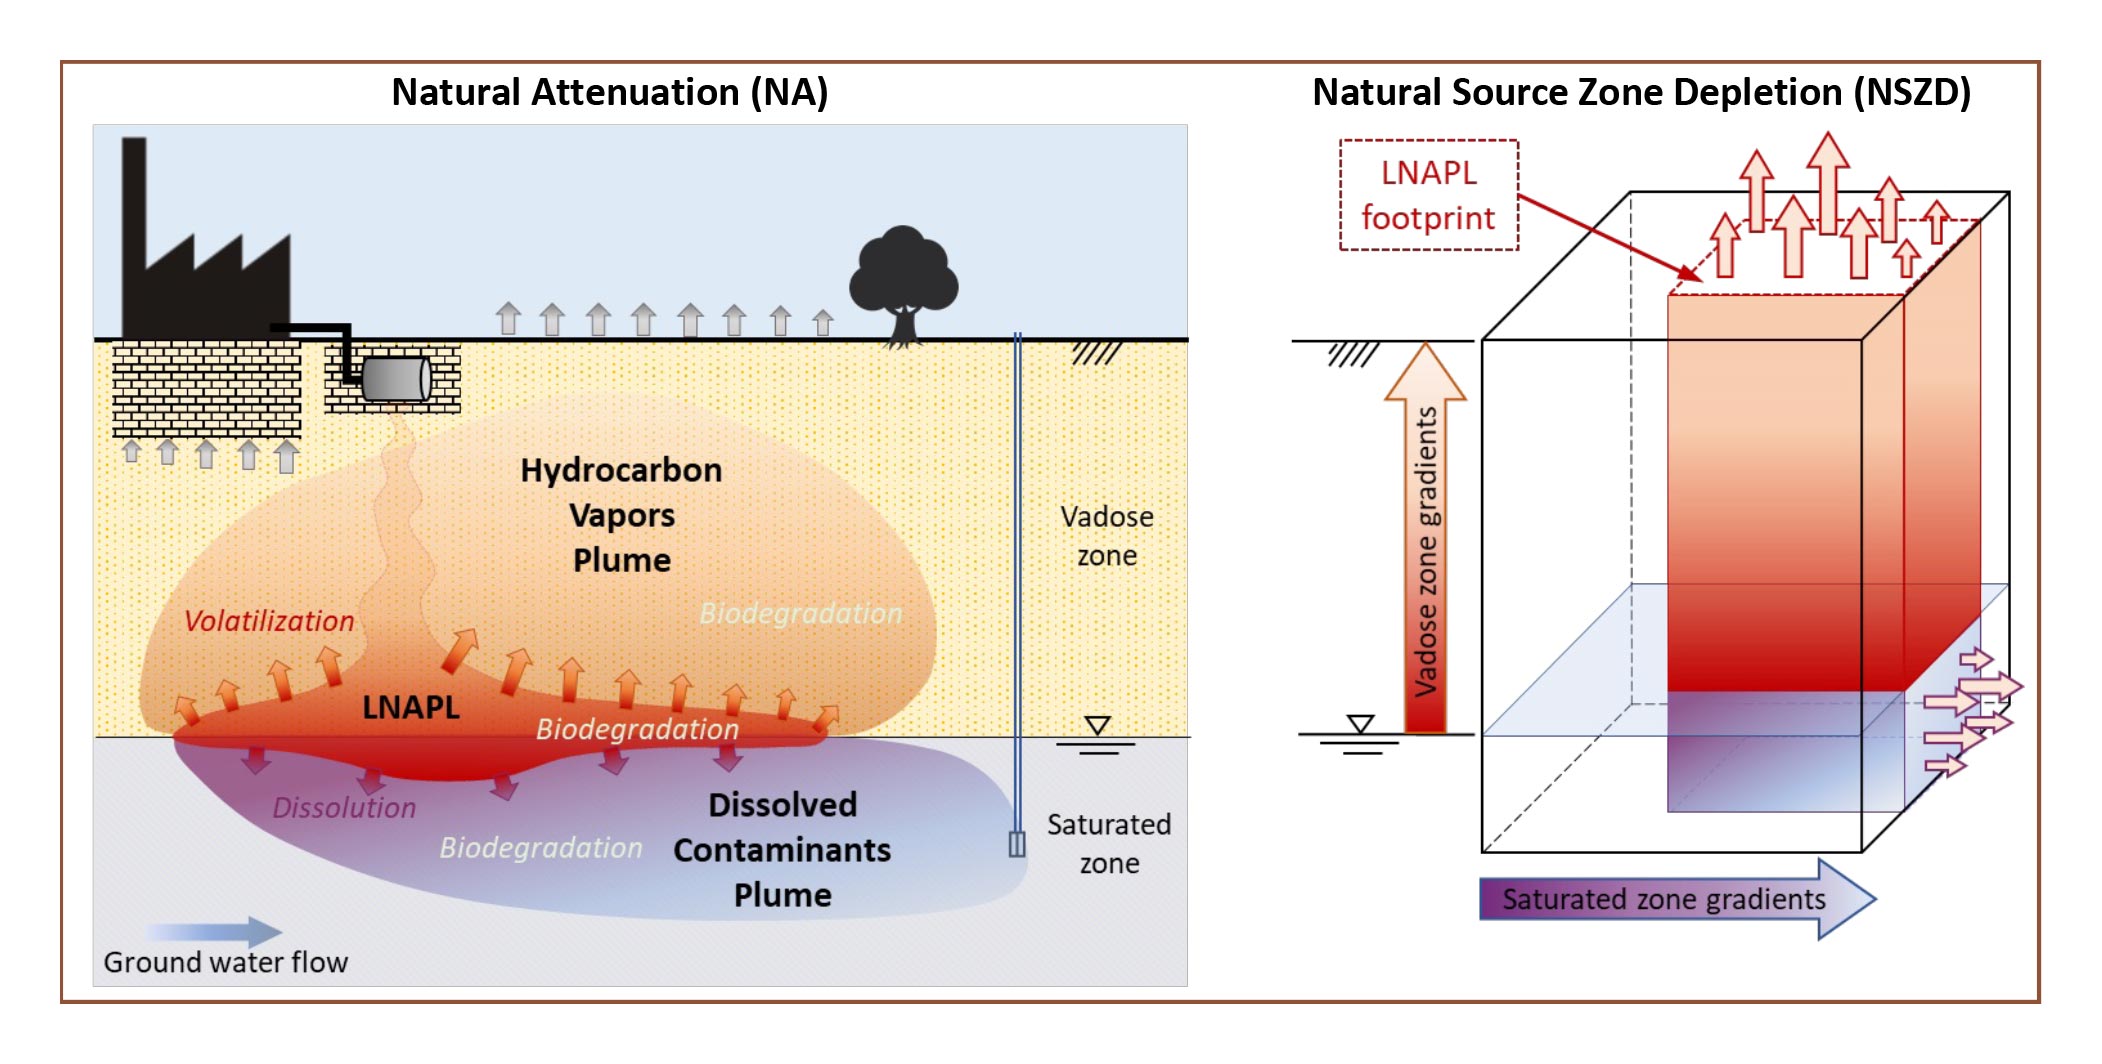
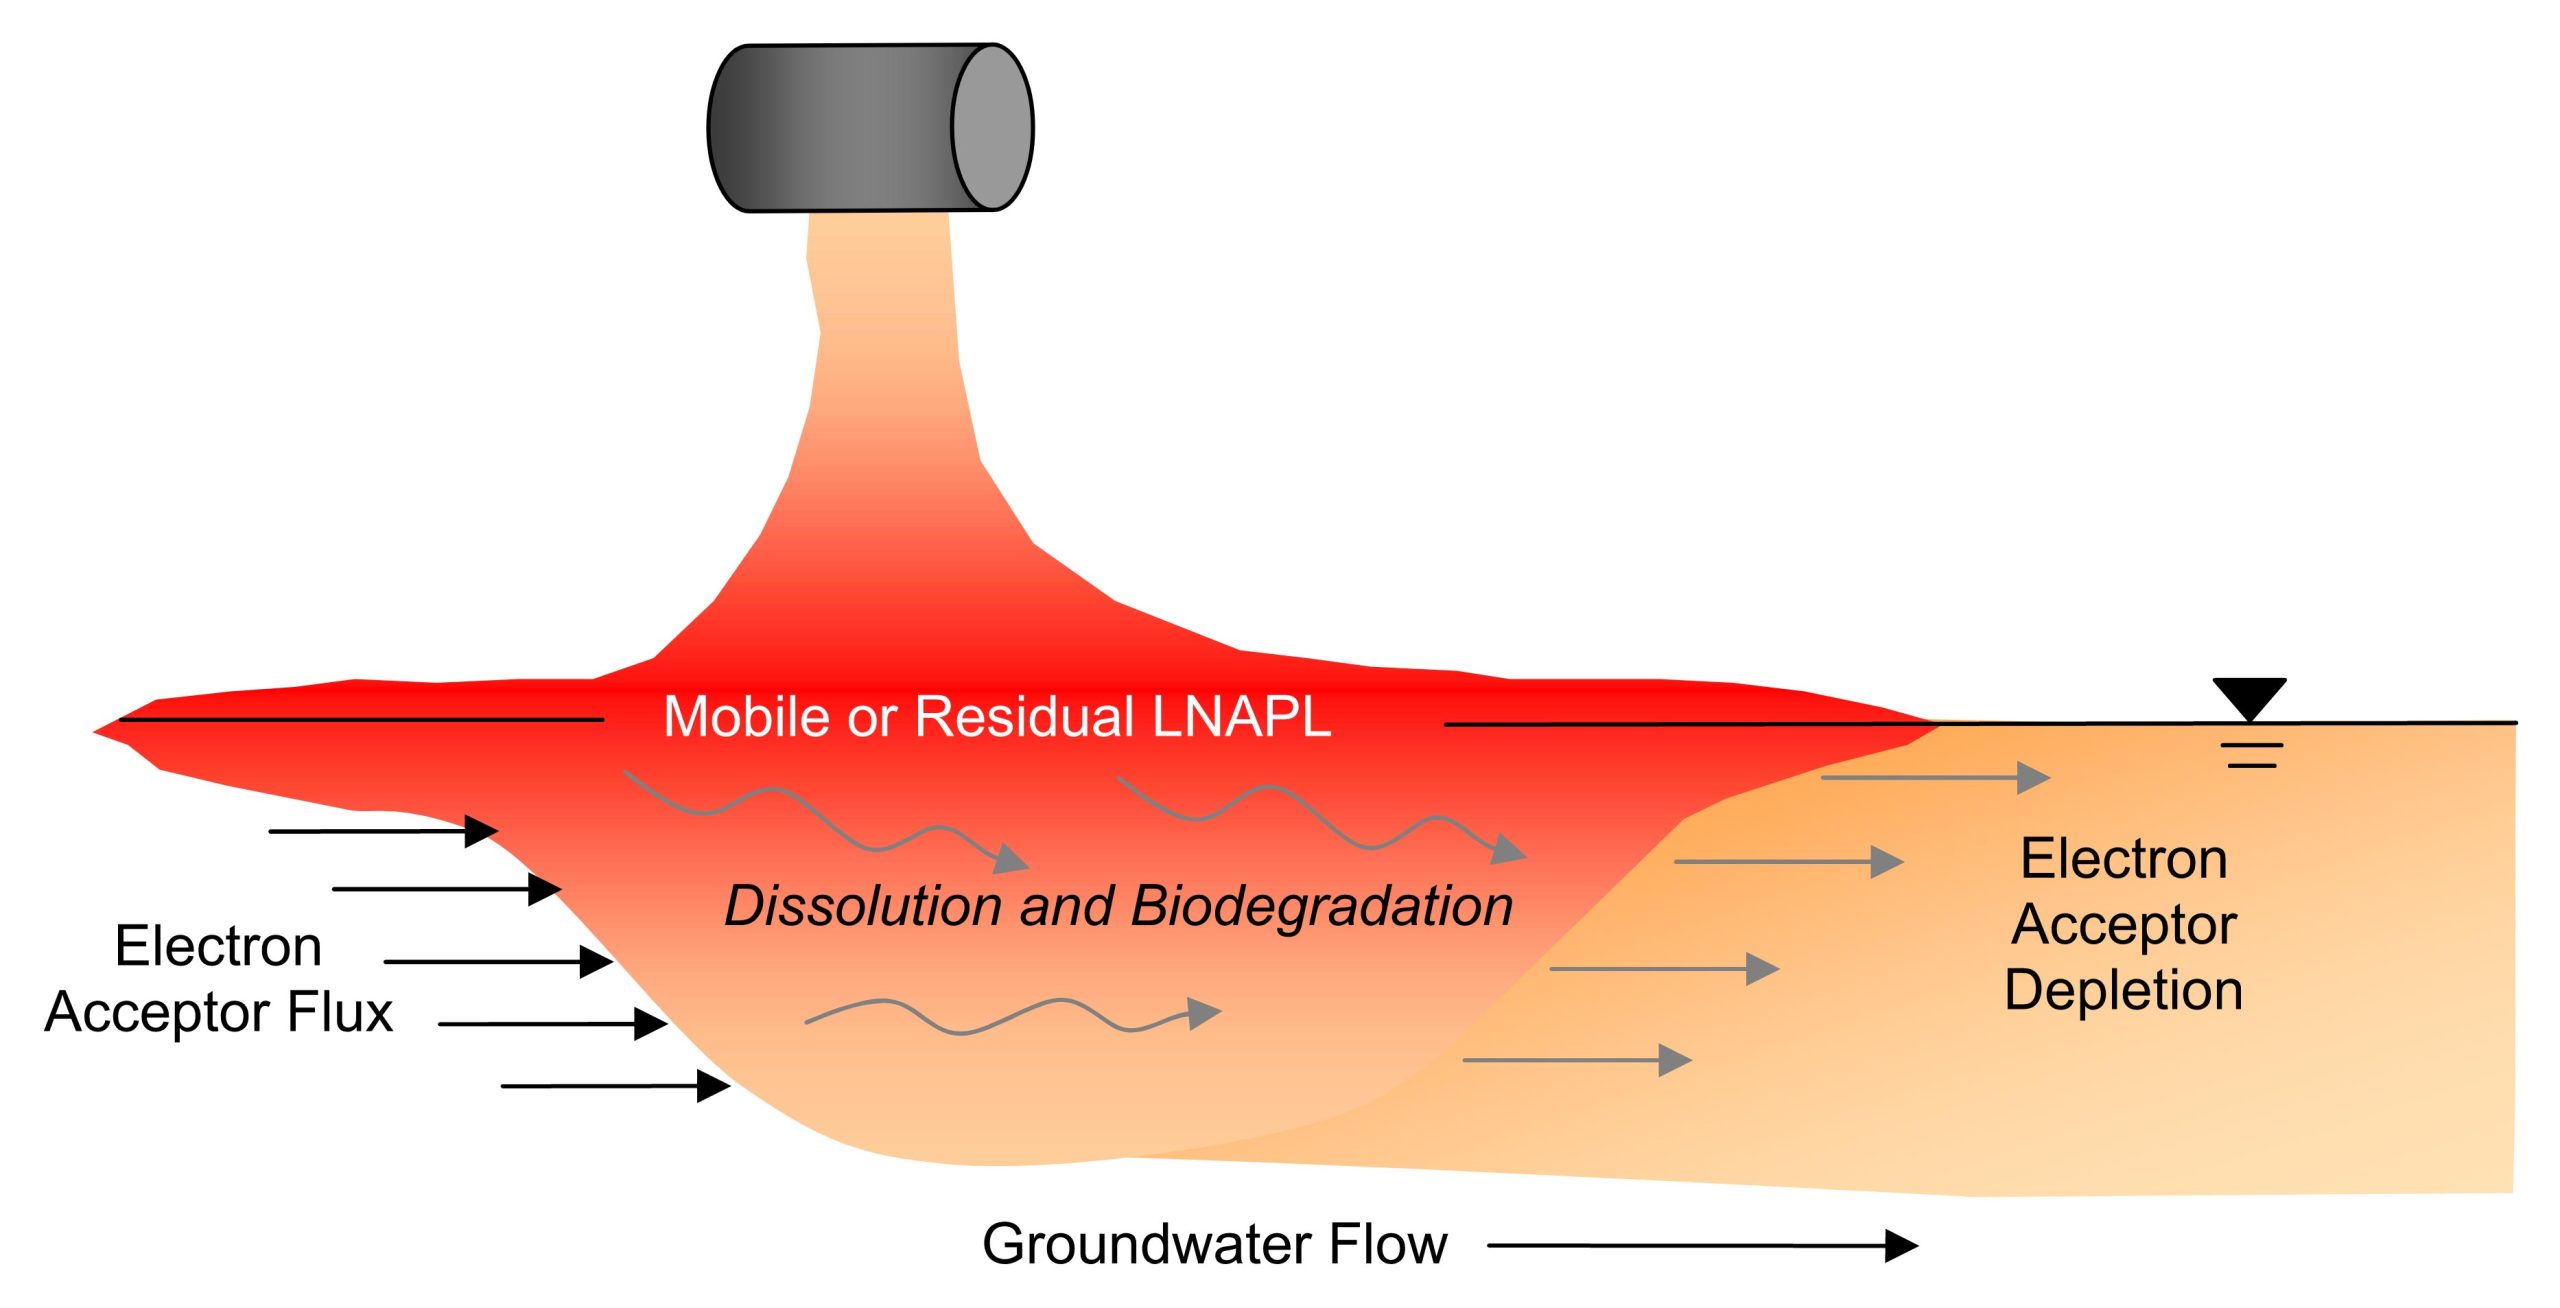
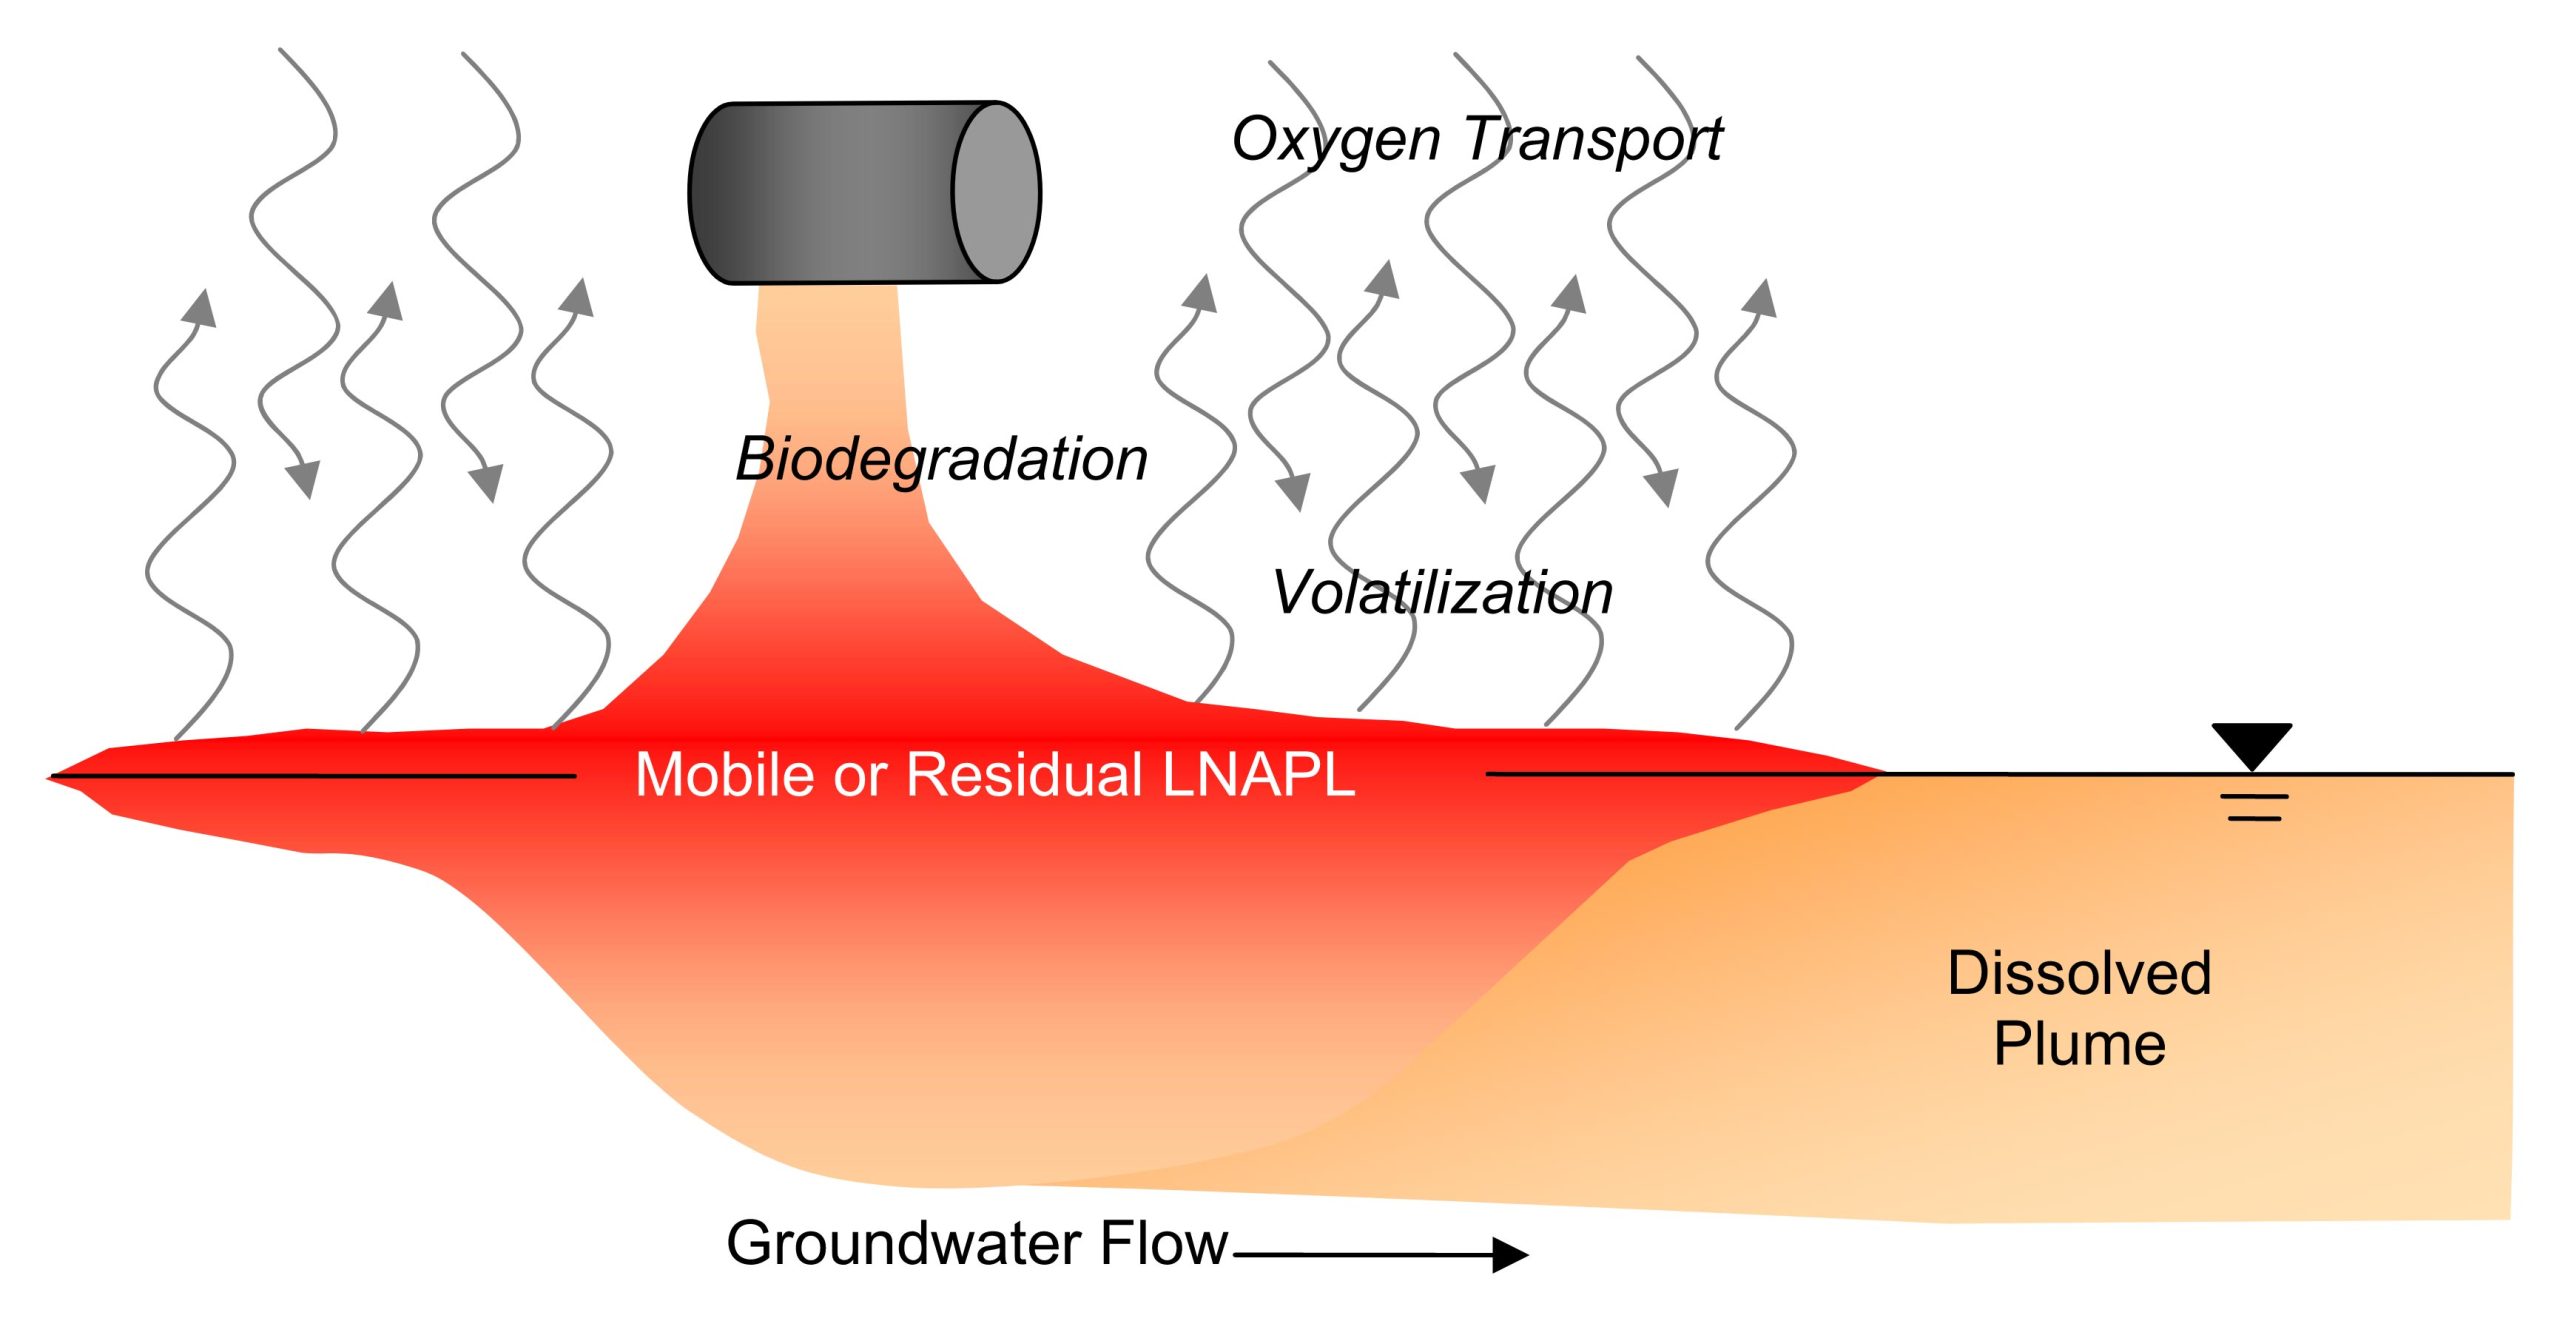
Figure 1 – Conceptual representation of Natural Attenuation (NA) and Natural Source Zone Depletion (NSZD).
Quantification of Natural Attenuation Processes
Table 1 provides a summary of widely available tools for the assessment of NA rates. Tools selection will largely depend on:
- whether the remedial concerns and goals are saturation- (migration or mobility), and/or composition-based (Table 1 and Figure 1 of Compendium);
- the dominant NA process;
- source depth and location relative to the water table;
- soil stratigraphy; and
- ground surface condition (paved, open ground).
- before active remediation is implemented to document baseline conditions and evaluate the need for active remediation;
- during active remediation to support performance optimization and assess radius of influence; and,
- after active remediation to validate remedial effectiveness (e.g., rebound testing) and potential transitions to MNA, no further action (NFA), or site closure.
- maintain consistency in methods and measurements used for NA assessment throughout the remedial decision-making process, in particular, for the Baseline Assessment (Stage 2) and Transition Assessment and Validation (Stage 4) (see Compendium);
- include measurements of NA rates in background locations (i.e., hydraulically up- or side-gradient from the area where PHCs are present in the subsurface), or include radiocarbon (14C) isotope analyses, depending on the method (see Quantifying NSZD Rates (1) in Table 1);
- understand that predicting the minimum time1 required to meet a remedial goal based on estimates of NA rates also requires estimates of the PHC source mass, where estimation is limited to within an order of magnitude (see Table 1).
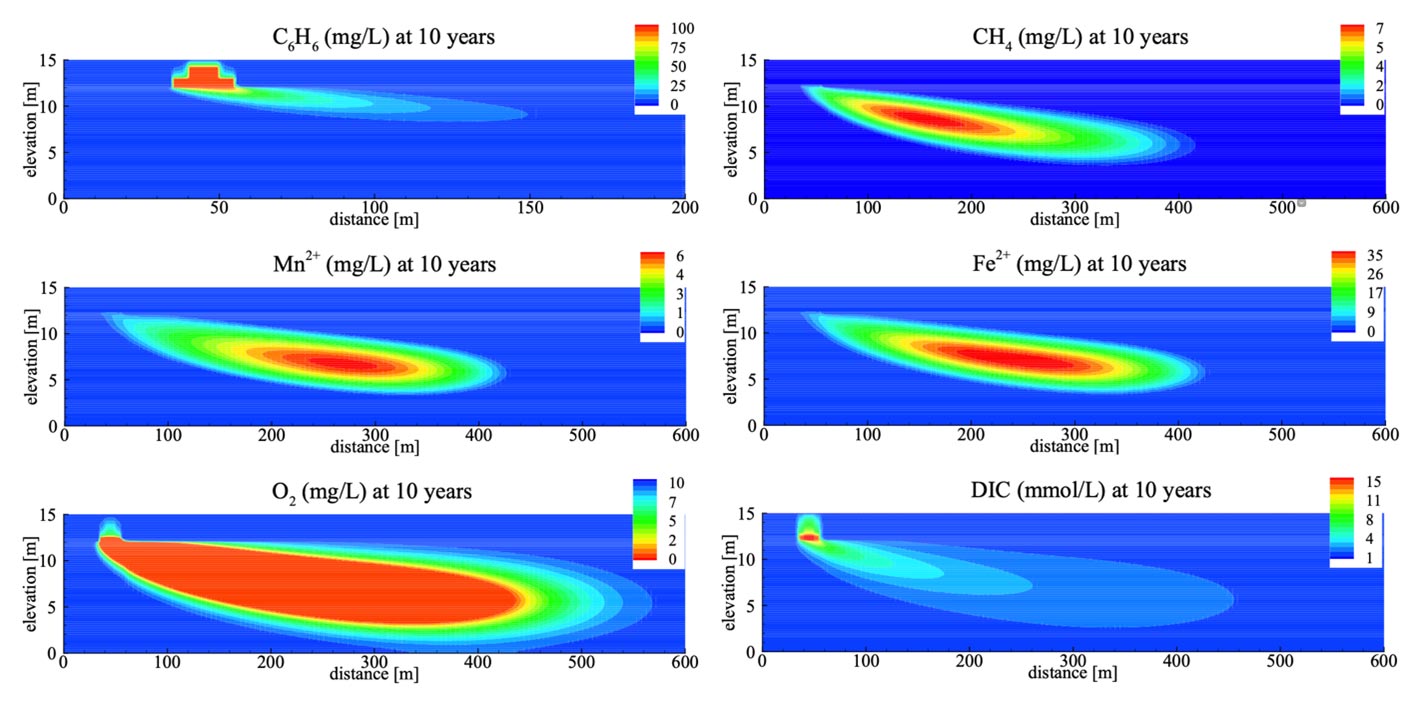
Biodegradation plays a significant role in the PHC attenuation that occurs via NA. Biodegradation can be validated and further quantified through an examination of:
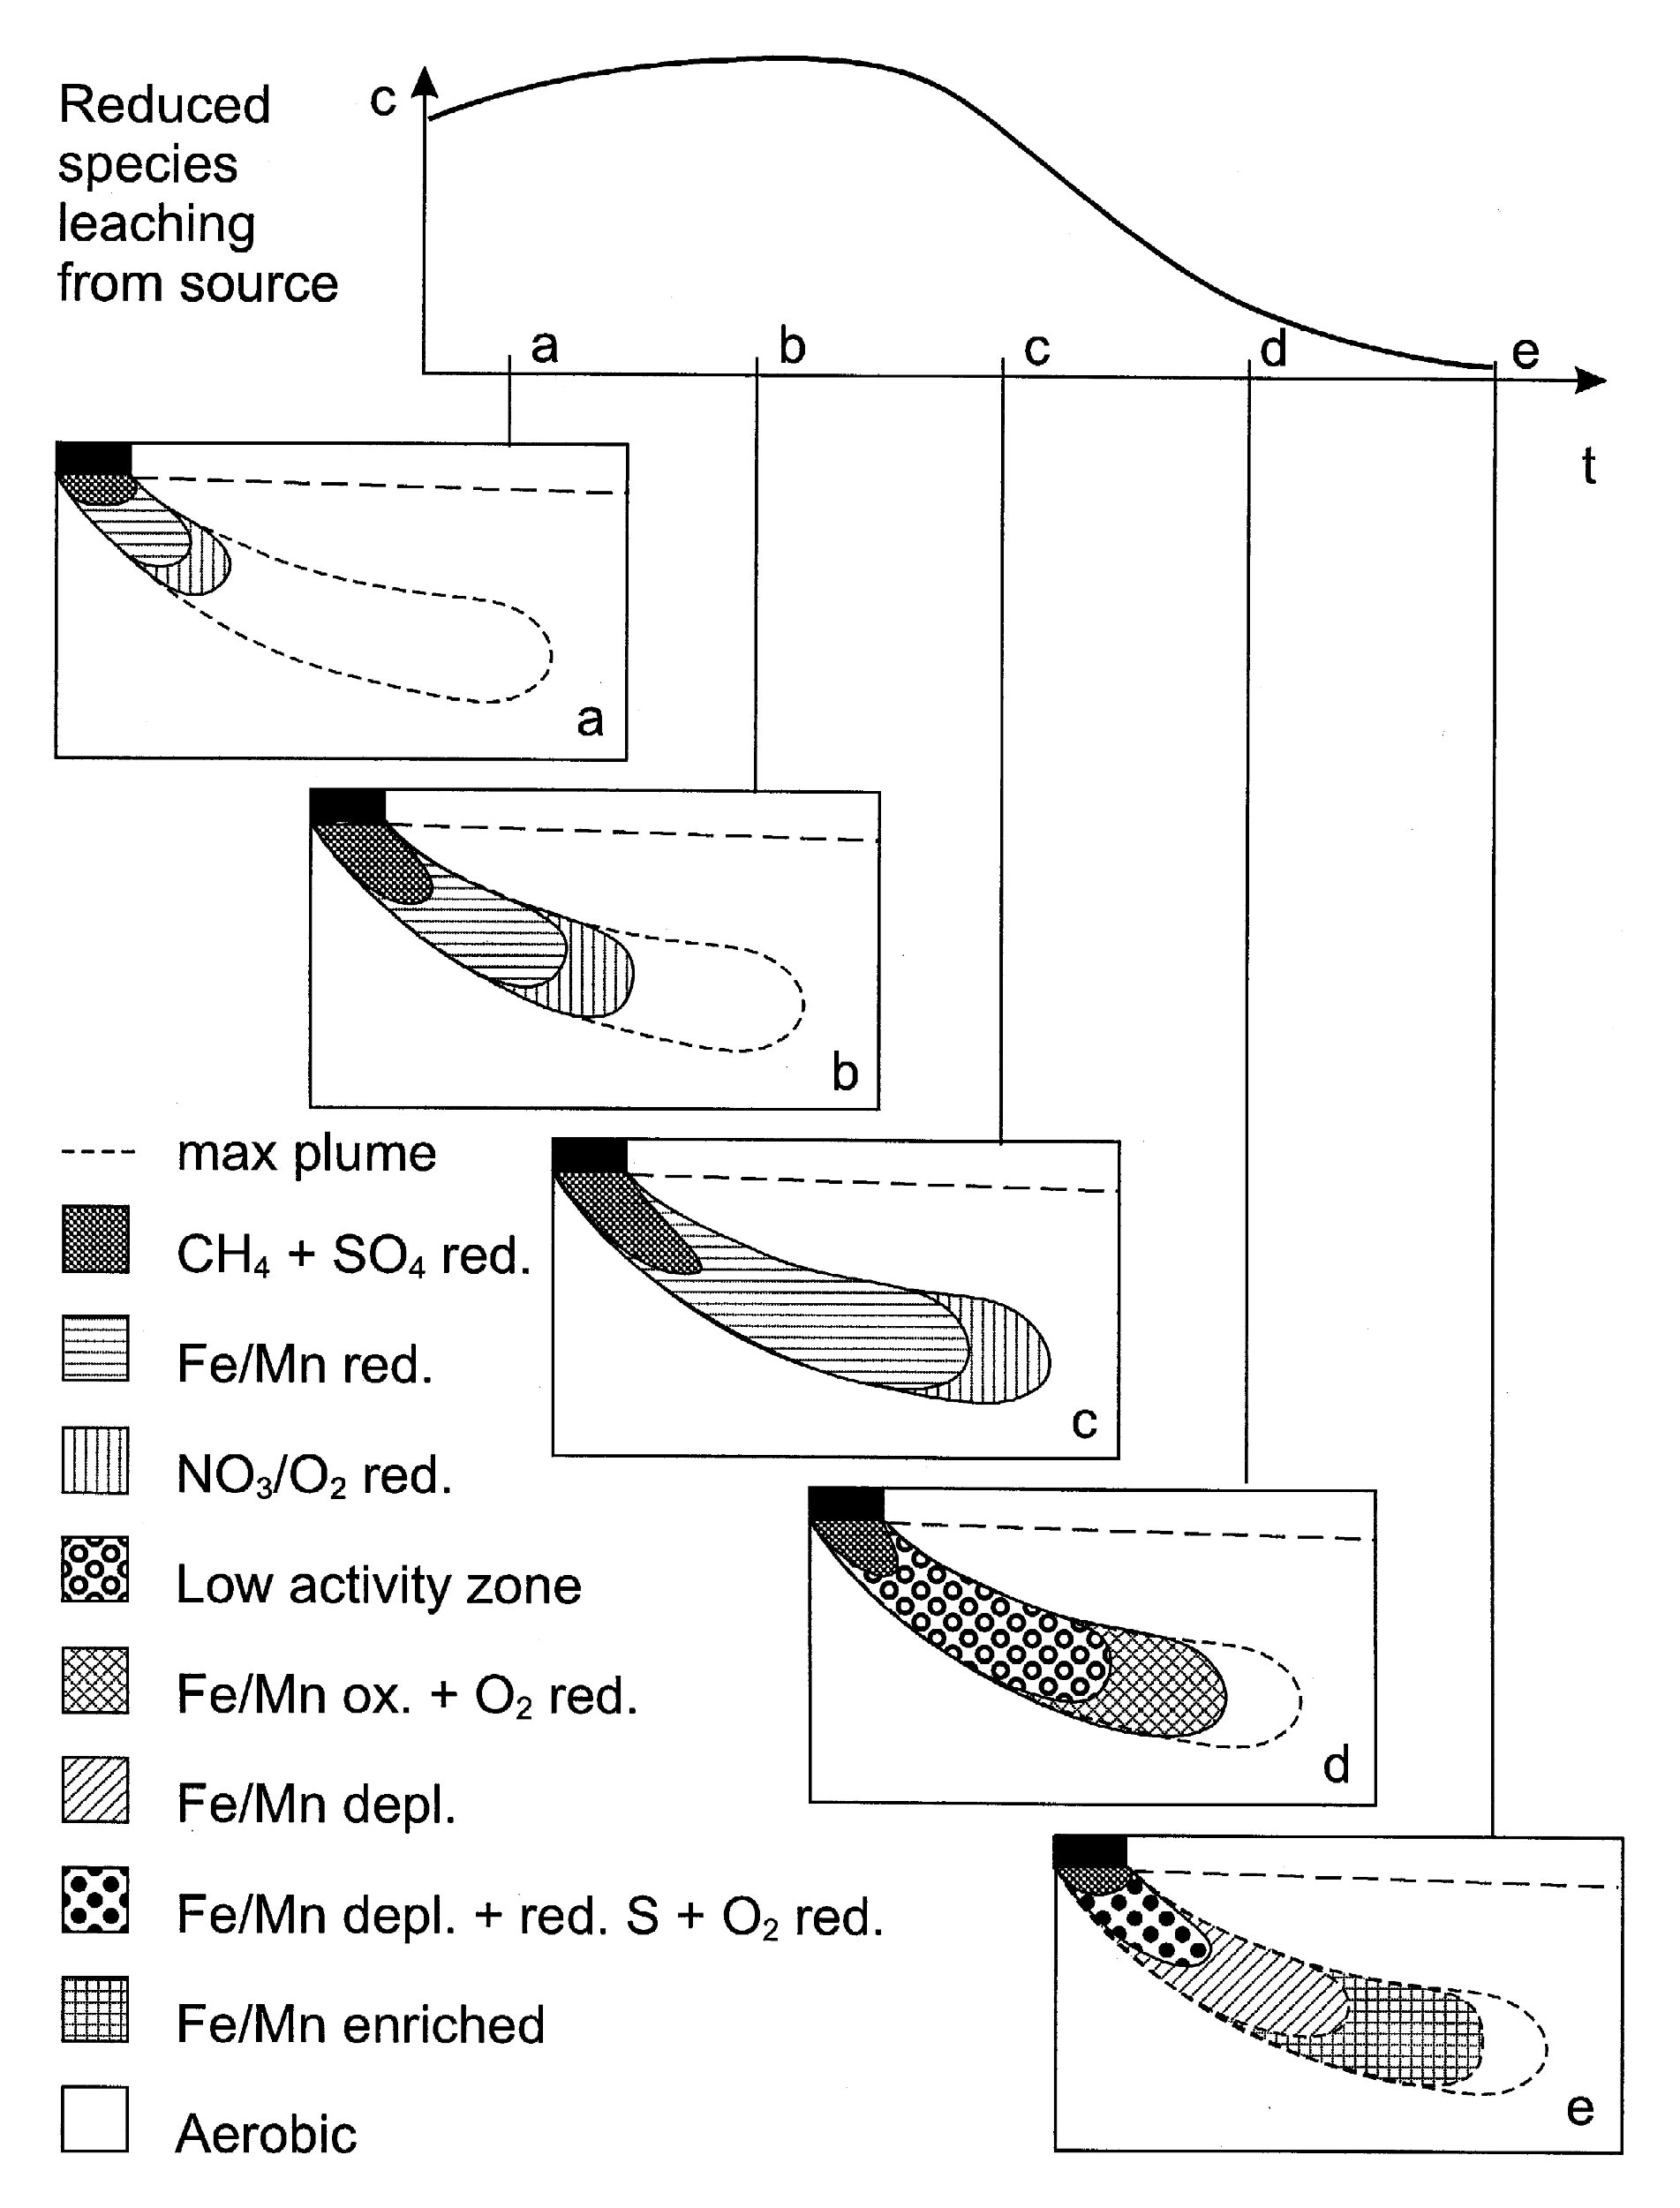
- changes in redox conditions and concentrations of terminal electron acceptors in groundwater between upgradient and downgradient locations from the LNAPL source;
- soil gas concentrations in samples collected from soil gas probes or the headspace of monitoring wells (field or laboratory measurements), in particular:
- lower O2 concentrations relative to background locations;
- elevated CO2 and CH4 concentrations; and
- laboratory measurement of N2 and Ar that are depleted or enriched relative to background locations as a result of CH4 generation or oxidation, respectively, and pressure-driven flow (ASTM 2016; Amos et al. 2005; and Molins et al. 2010).
- changes in the subsurface temperature profile within the LNAPL-impacted areas as an indicator of the zone of aerobic/anaerobic interface (see Appendix X2 of ASTM E3661 2022).
| Tool | Data Requirements | Long term monitoring required? | Primary Purpose | Remedial Concern | |
|---|---|---|---|---|---|
| Quantifying NSZD Rates (1) | CO2 Efflux | Estimating source depletion rates | Saturation | ||
| Temperature gradient | Saturation | ||||
| Soil gas gradient | Composition/ saturation | ||||
| Groundwater gradient | Composition / saturation | ||||
| LNAPL Compositional changes | composition | ||||
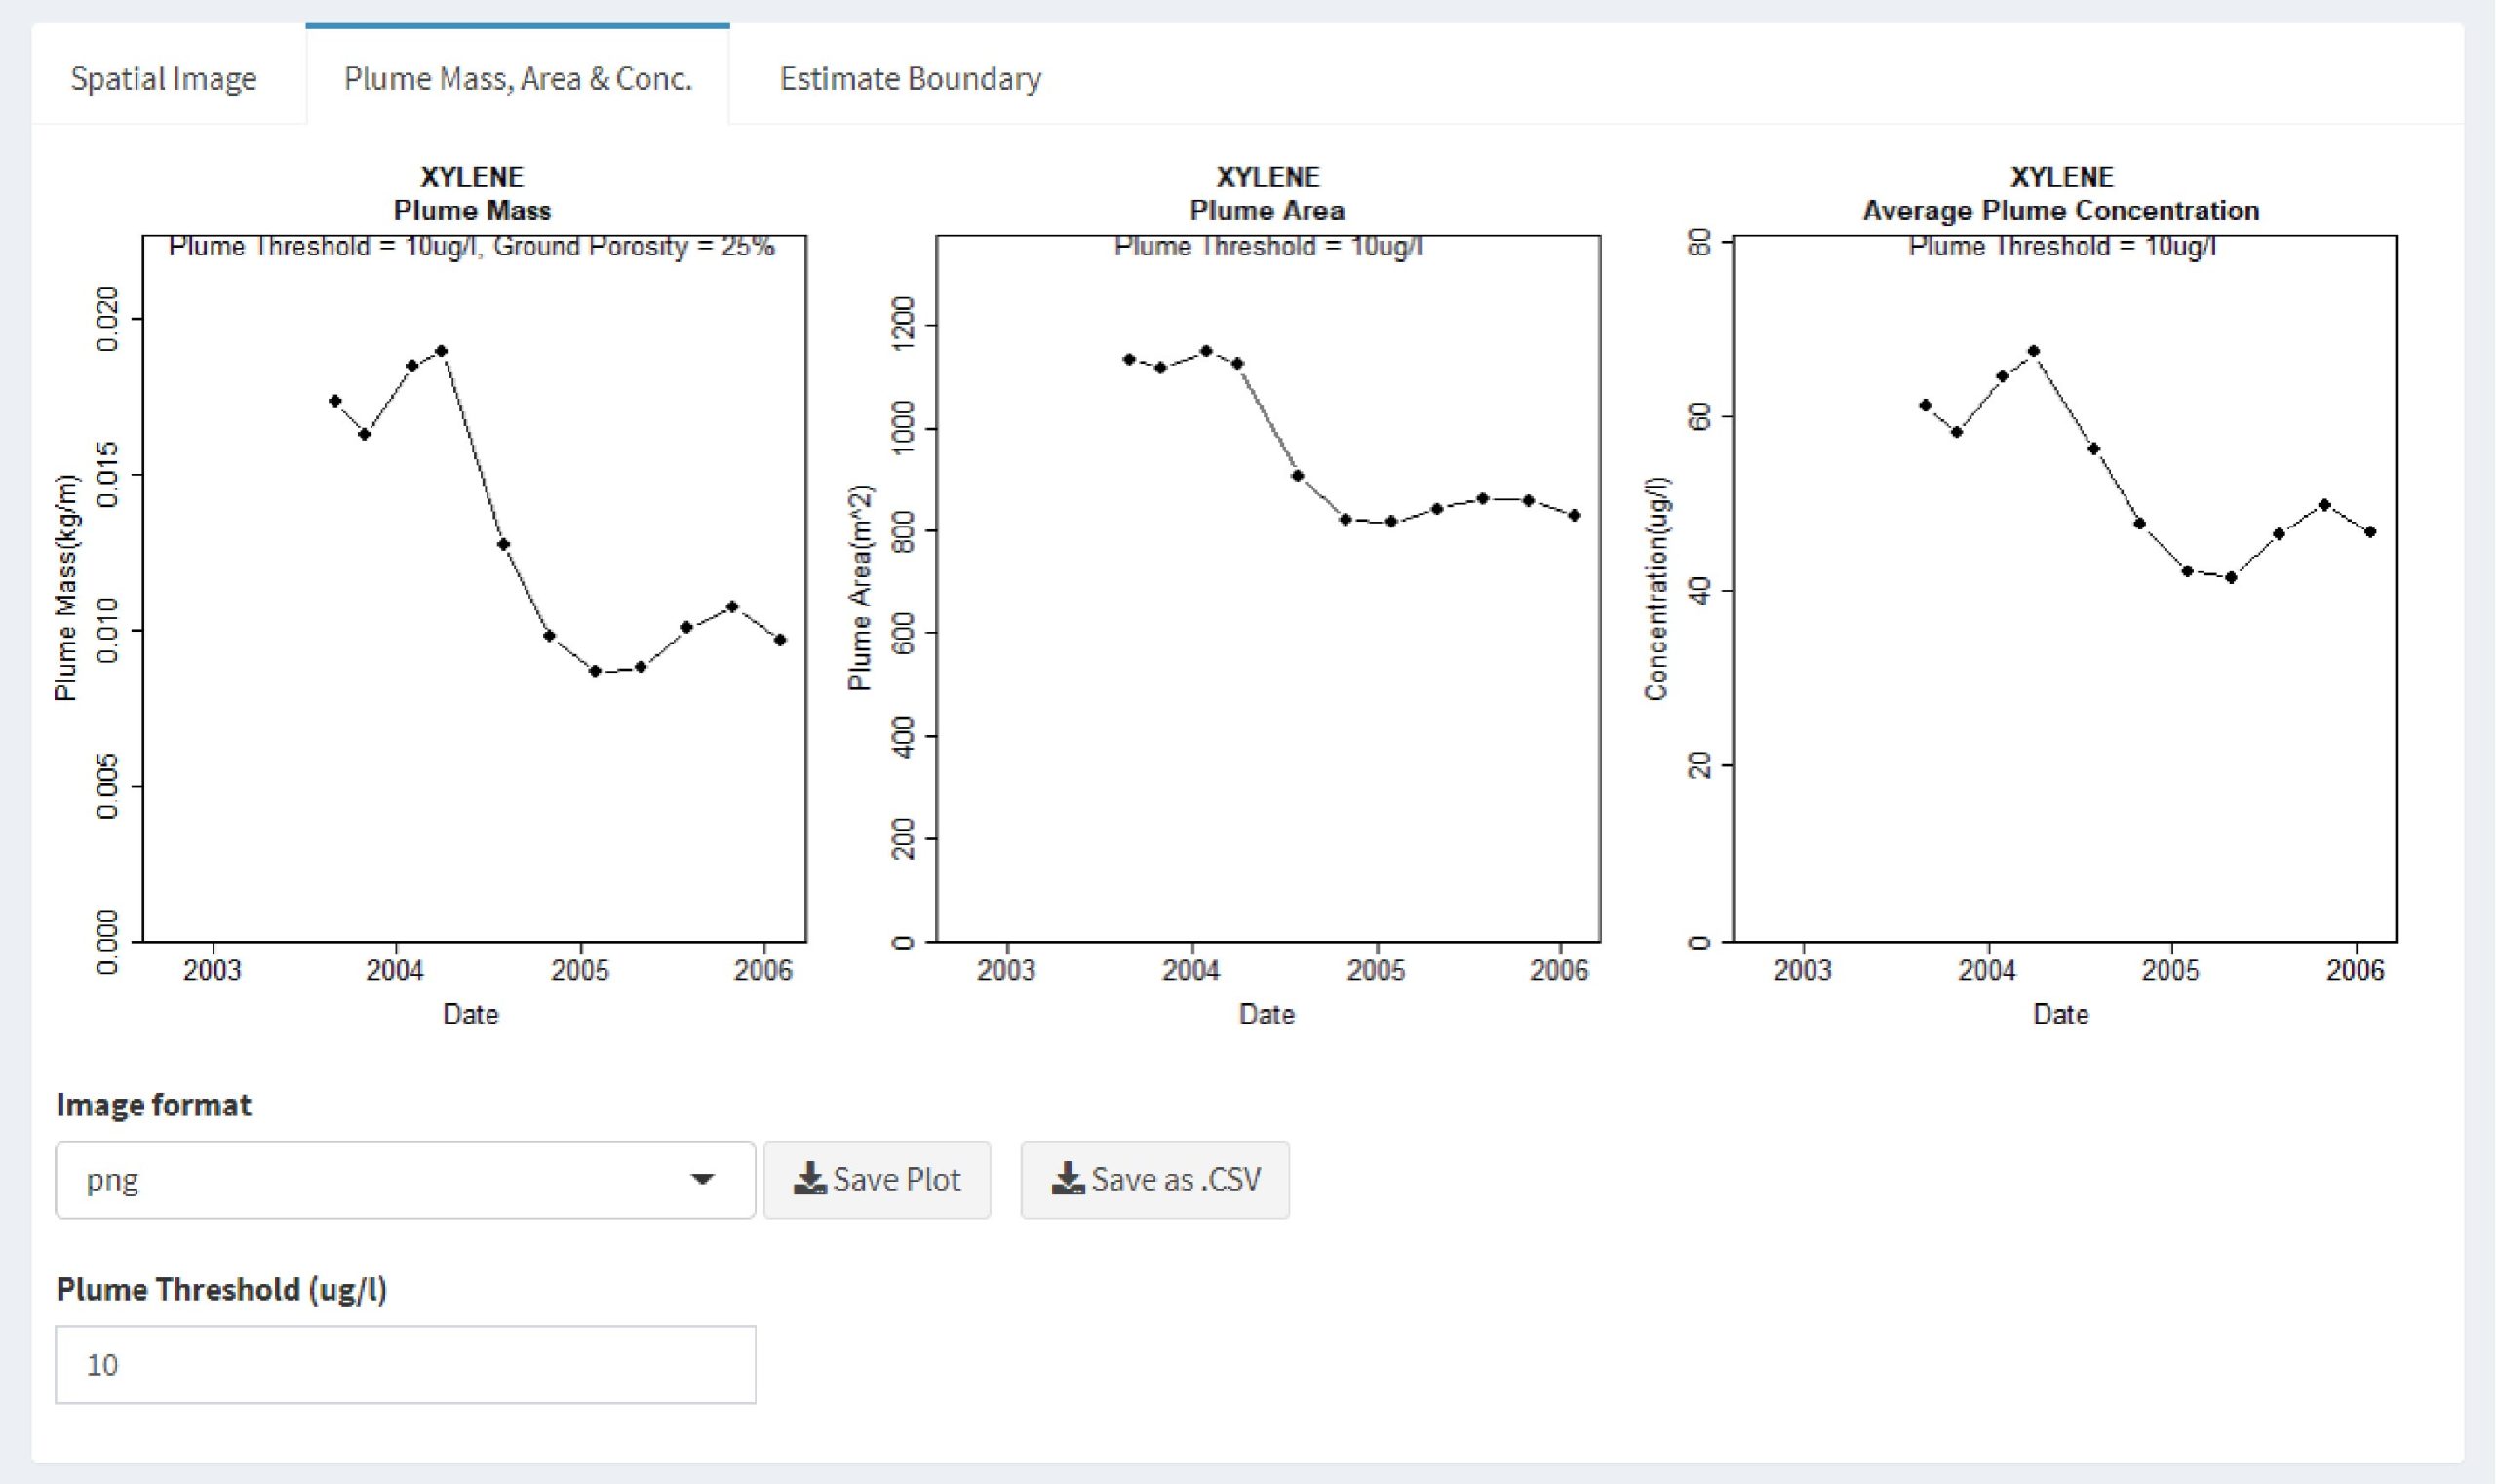
| Regression Analysis (2) | COC concentrations in groundwater | Trend analysis and time estimate to reach regulatory standard | composition | ||
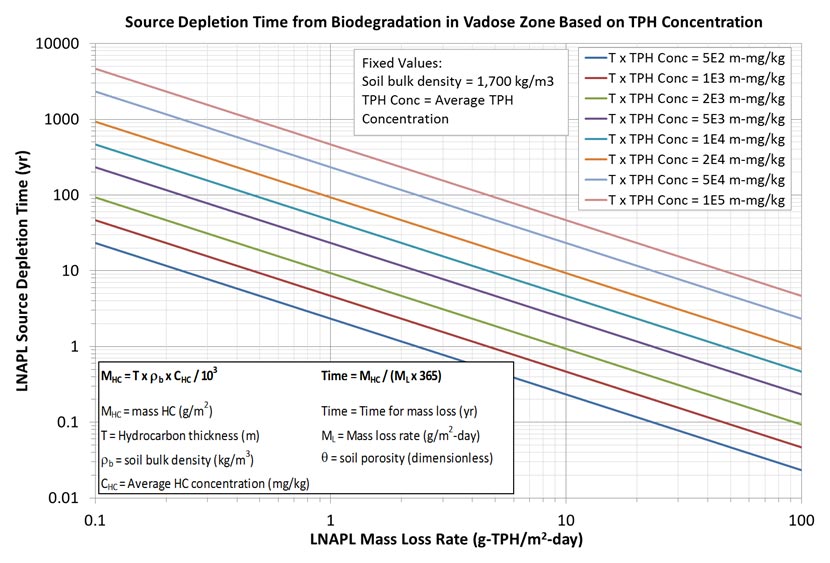
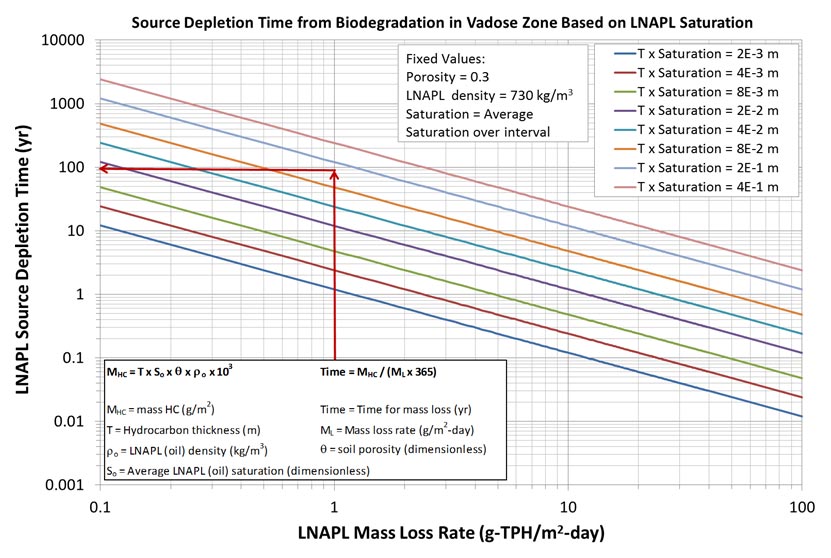
| Nomograph for Source Depletion (3) | Average TPH concentration in soil & thickness + biodegradation rate | Estimating the minimum source depletion times1 | saturation | ||
| LNAPL saturation & thickness + biodegradation rate | |||||
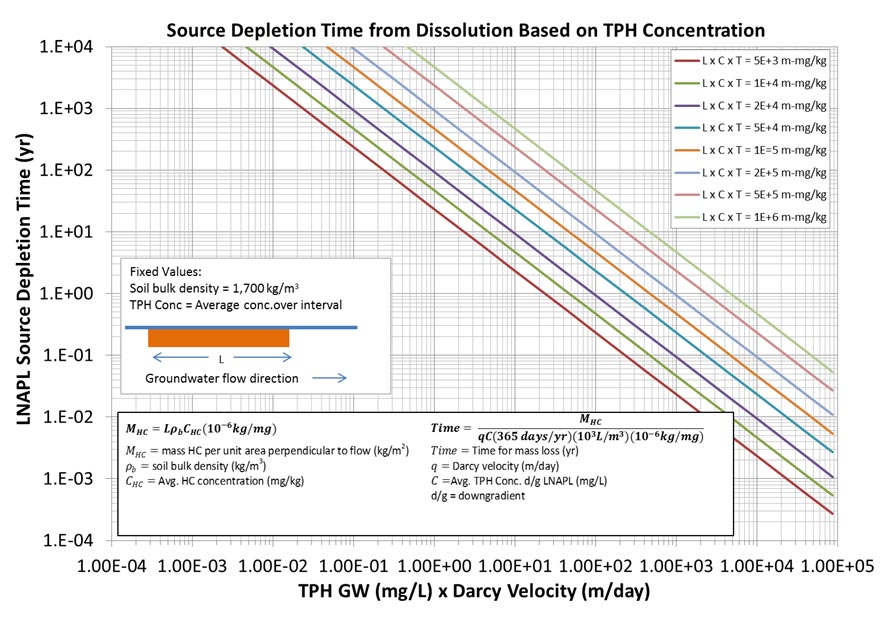
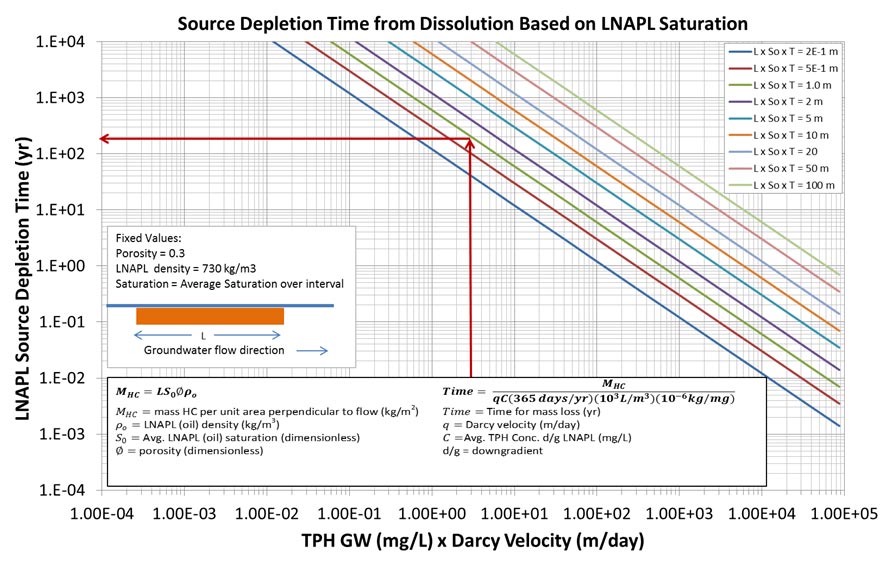
| Average TPH concentration in soil & thickness + groundwater flow rate | |||||
| LNAPL saturation and thickness + groundwater flow rate | |||||
| Groundwater Plume / LNAPL Body Stability (4) | COC concentrations in groundwater + water elevation + LNAPL presence/absence | Assessment of groundwater plume stability | composition | ||
| Groundwater Geochemical Parameters (5) | groundwater geochemical data collected upgradient, within and downgradient of the source zone | Lines of evidence evaluation of biodegradation | saturation | ||
| Groundwater Attenuation Rates (6) | COC concentrations in groundwater | Estimates of attenuation rates for plume duration and trend | composition | ||
| Mass Discharge Estimation (7) | COC concentrations in groundwater + hydrogeological properties | Mass-based estimate of attenuation rates; trends and timelines | composition | ||
| Screening Level Source Depletion Rates (8) | groundwater geochemical data collected upgradient, within and downgradient of the source zone; and O2 concentration profile in soil gas, soil properties and the representative hydrocarbon | Estimating source depletion rates | saturation | ||
| Solute Transport Models (1D Analytical) (9) | COC biodegradation rate constants Hydrogeological parameters + LNAPL source properties | Groundwater plume prediction and remediation timeline | composition | ||
| Multi-component / Multi-dimensional Numerical Models (10) | COC physico-chemical properties + hydrogeological properties + boundary & initial conditions | Prediction of COC concentrations in time and space | composition | ||
| Evaluating Remediation Performance (11) | COC concentrations in soil gas or groundwater (application dependent) | Rebound and respiration testing (SVE); Mass discharge estimates (P&T) | composition |
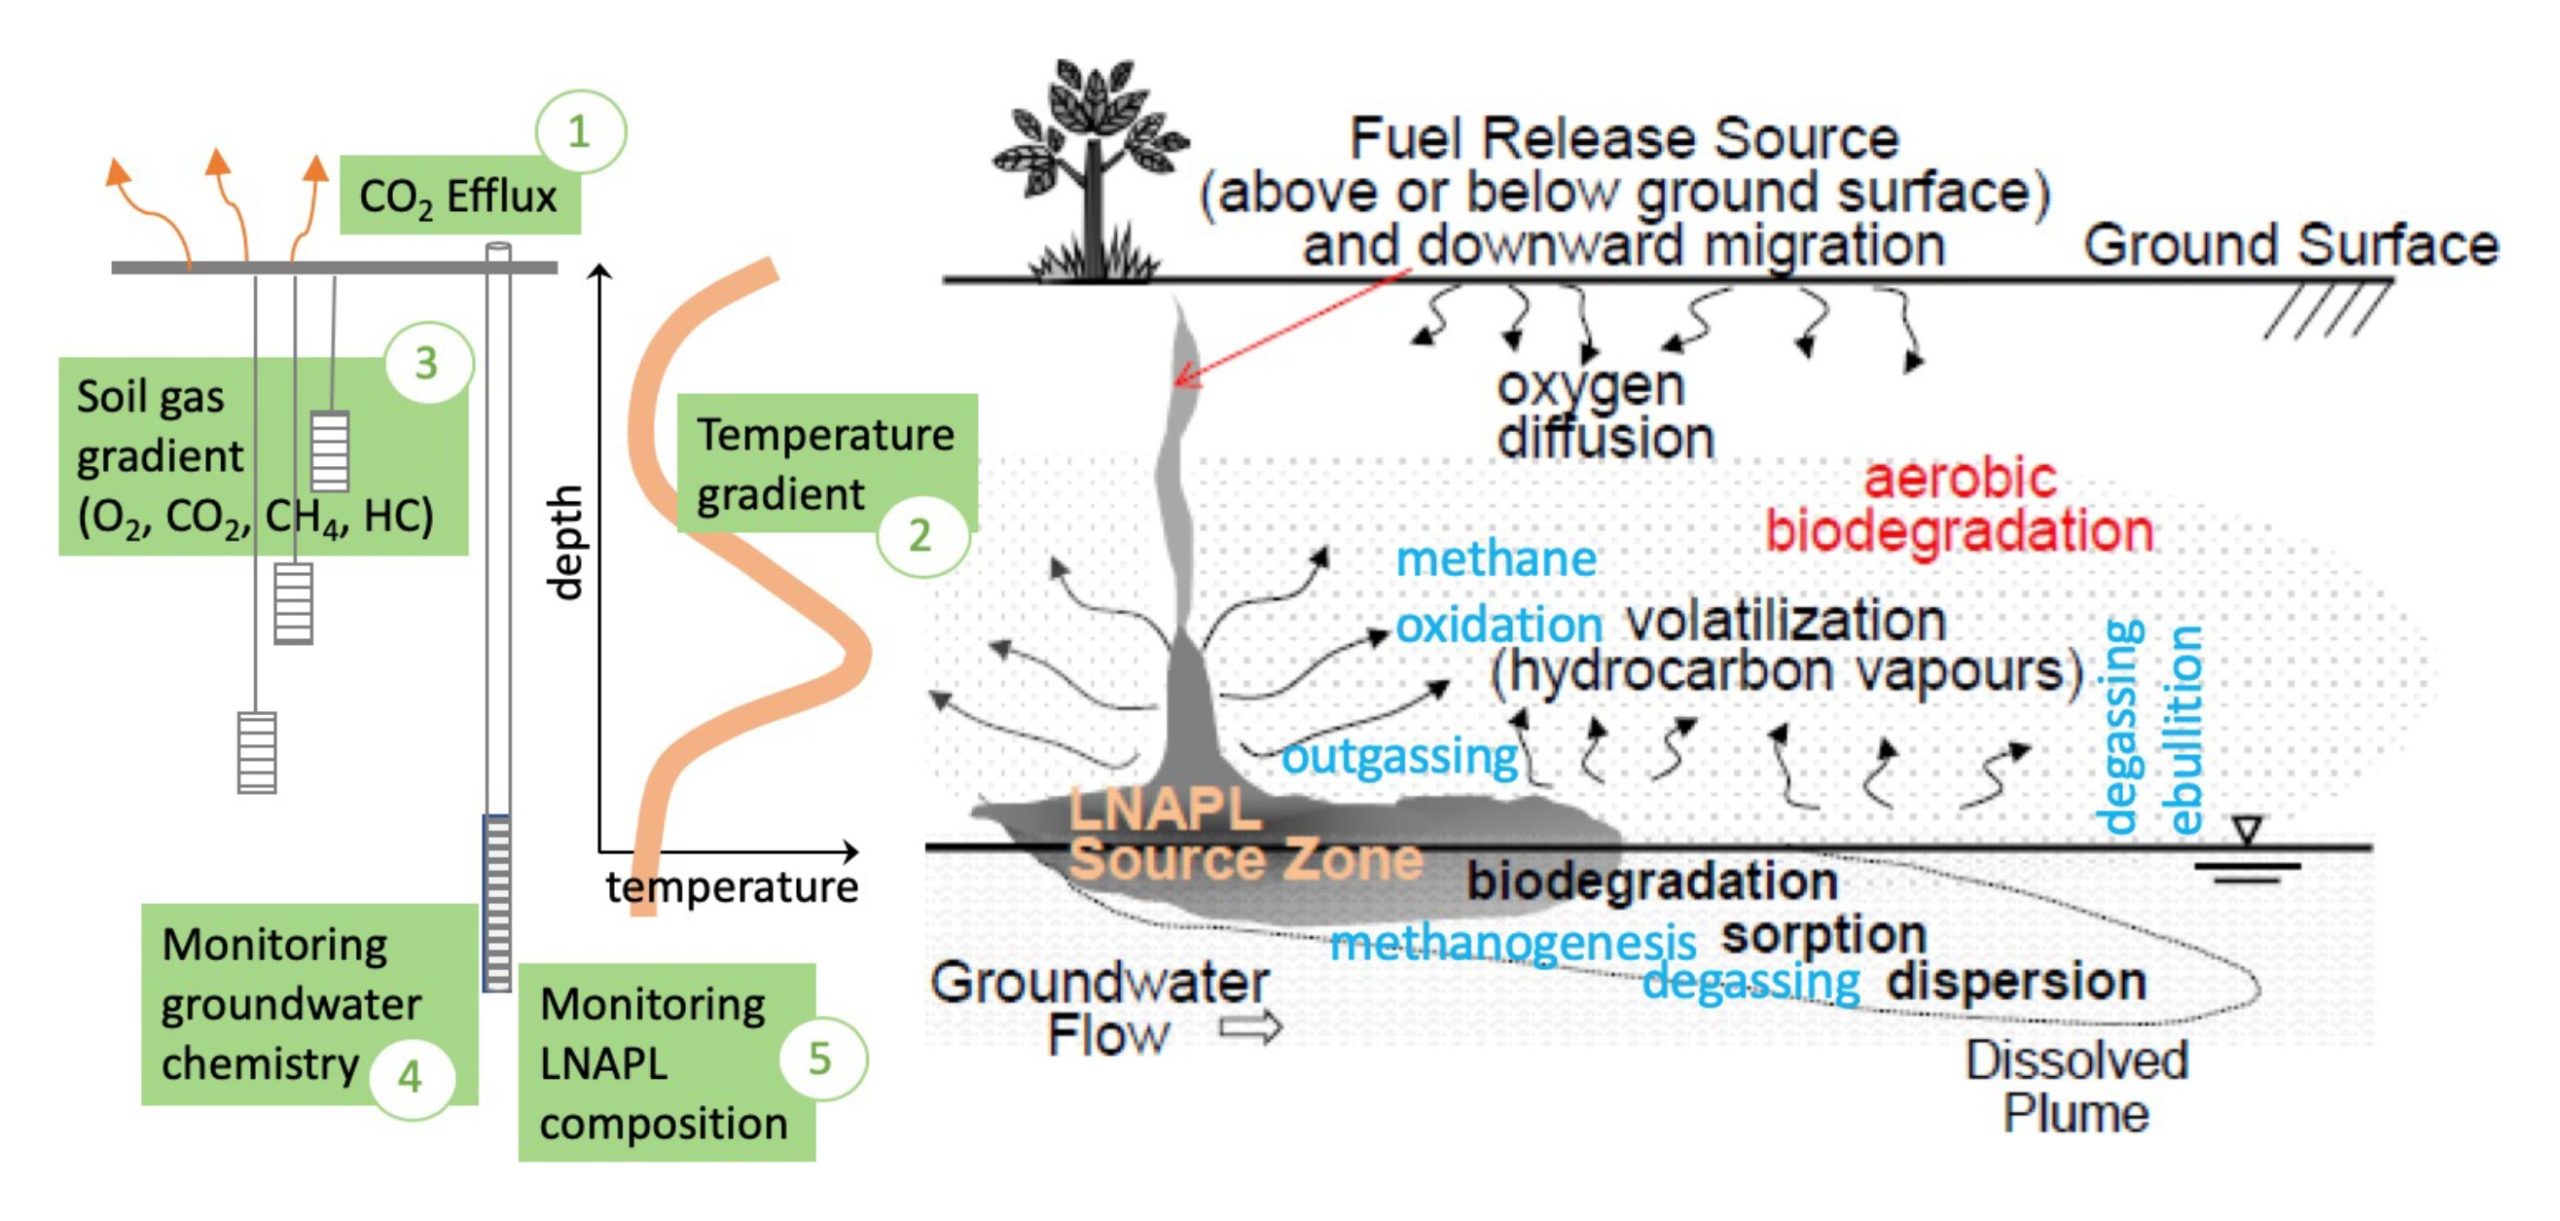
1. Methods for NSZD Rate Estimates
- CO2 released from biodegradation of PHCs in the subsurface and transported through diffusion and advection to the ground surface;
- changes in the soil temperature resulting from exothermic biodegradation of PHCs in the subsurface;
- changes in soil gas chemistry in the vadose zone resulting from biodegradation and transport of chemical reactants and reaction by-products in the subsurface (mainly O2, CO2, PHCs, and CH4);
- changes in groundwater chemistry resulting from dissolution of PHCs, biodegradation, and flow in the saturated zone; and
- changes in LNAPL composition.
- whether the remedial concerns are saturation (migration/mobility) and/or composition2 (Table 1 and Figure 1 of Compendium);
- the dominant natural attenuation process based on LNAPL distribution above or below the water table;
- source depth and location relative to the water table;
- soil stratigraphy; and
- ground surface condition (paved, open ground).
More detailed information on NA methods can be found in ASTM E3361 (2022), including:
- available tools and methods;
- screening or feasibility assessment of the method for the site conditions
- data interpretation, key considerations, and challenges, such as:
- measurement frequency, locations, and estimating annual average of NA rates (site-wide or the LNAPL source zone) and,
- correcting for background sources;
- recommendations for QA/QC;
- methods for evaluating the performance of enhanced attenuation (or bioremediation) systems; and
- use of NA measurements to support source delineation or estimate mass discharge rates in soil gas or groundwater.
| Method | Type of Attenuation Measured1 | Location of processes & Pathway | Measurement Location |
|---|---|---|---|
| 1. CO2 Efflux | Bulk LNAPL | Vadose zone2 | Ground surface |
| 2. Temperature Gradient | Bulk LNAPL | Vadose zone2 | Vertical profile mostly in the vadose zone & straddling the capillary fringe near the source zone |
| 3. Soil Gas Gradient | Bulk LNAPL & COCs | Vadose zone2 | Vertical profile in the vadose zone near the source zone |
| 4. Groundwater Monitoring | Bulk LNAPL & COCs | Saturated zone3 | Profile along the groundwater flow path up- and down-gradient from the source zone |
| 5. LNAPL Composition | COCs | LNAPL Source zone | Source zone |
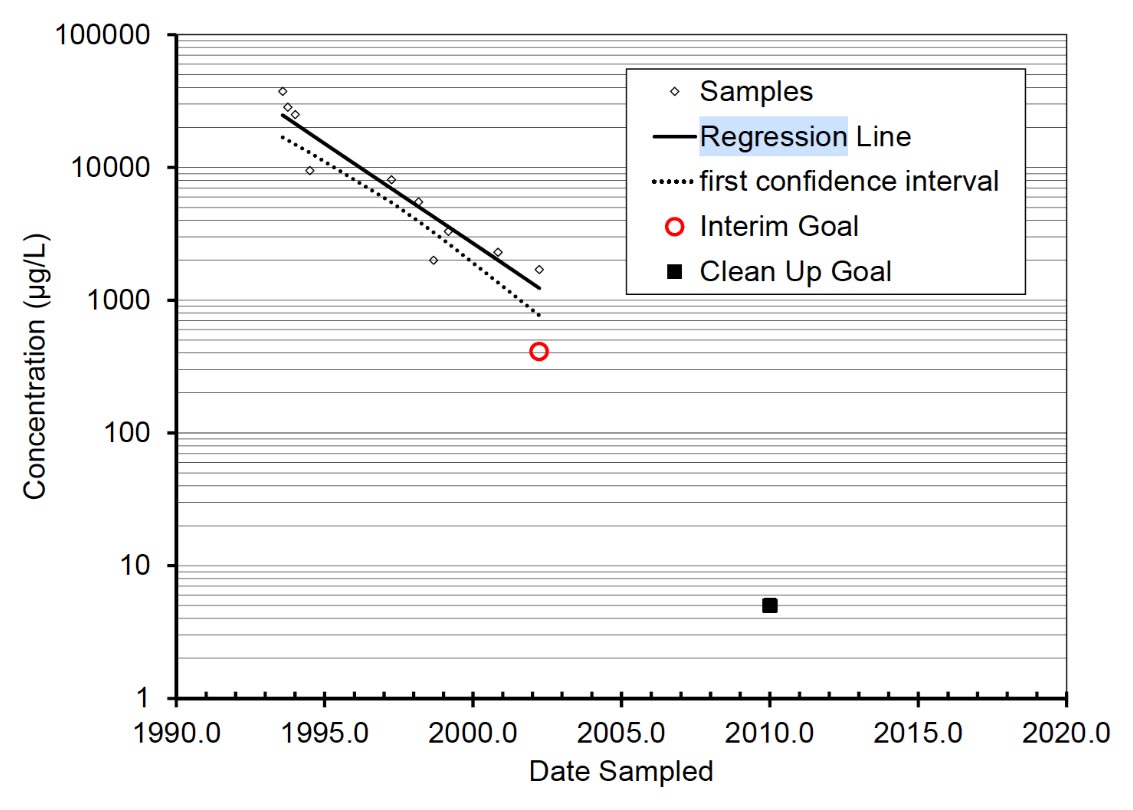
2. Regression Analysis
- Regression Analysis Tool (US EPA 2011)
- Non-parametric analysis such as Mann-Kendall:
- US EPA ProUCL statistics software
- GSI Environmental Monitoring and Remediation Optimization Software (MAROS)
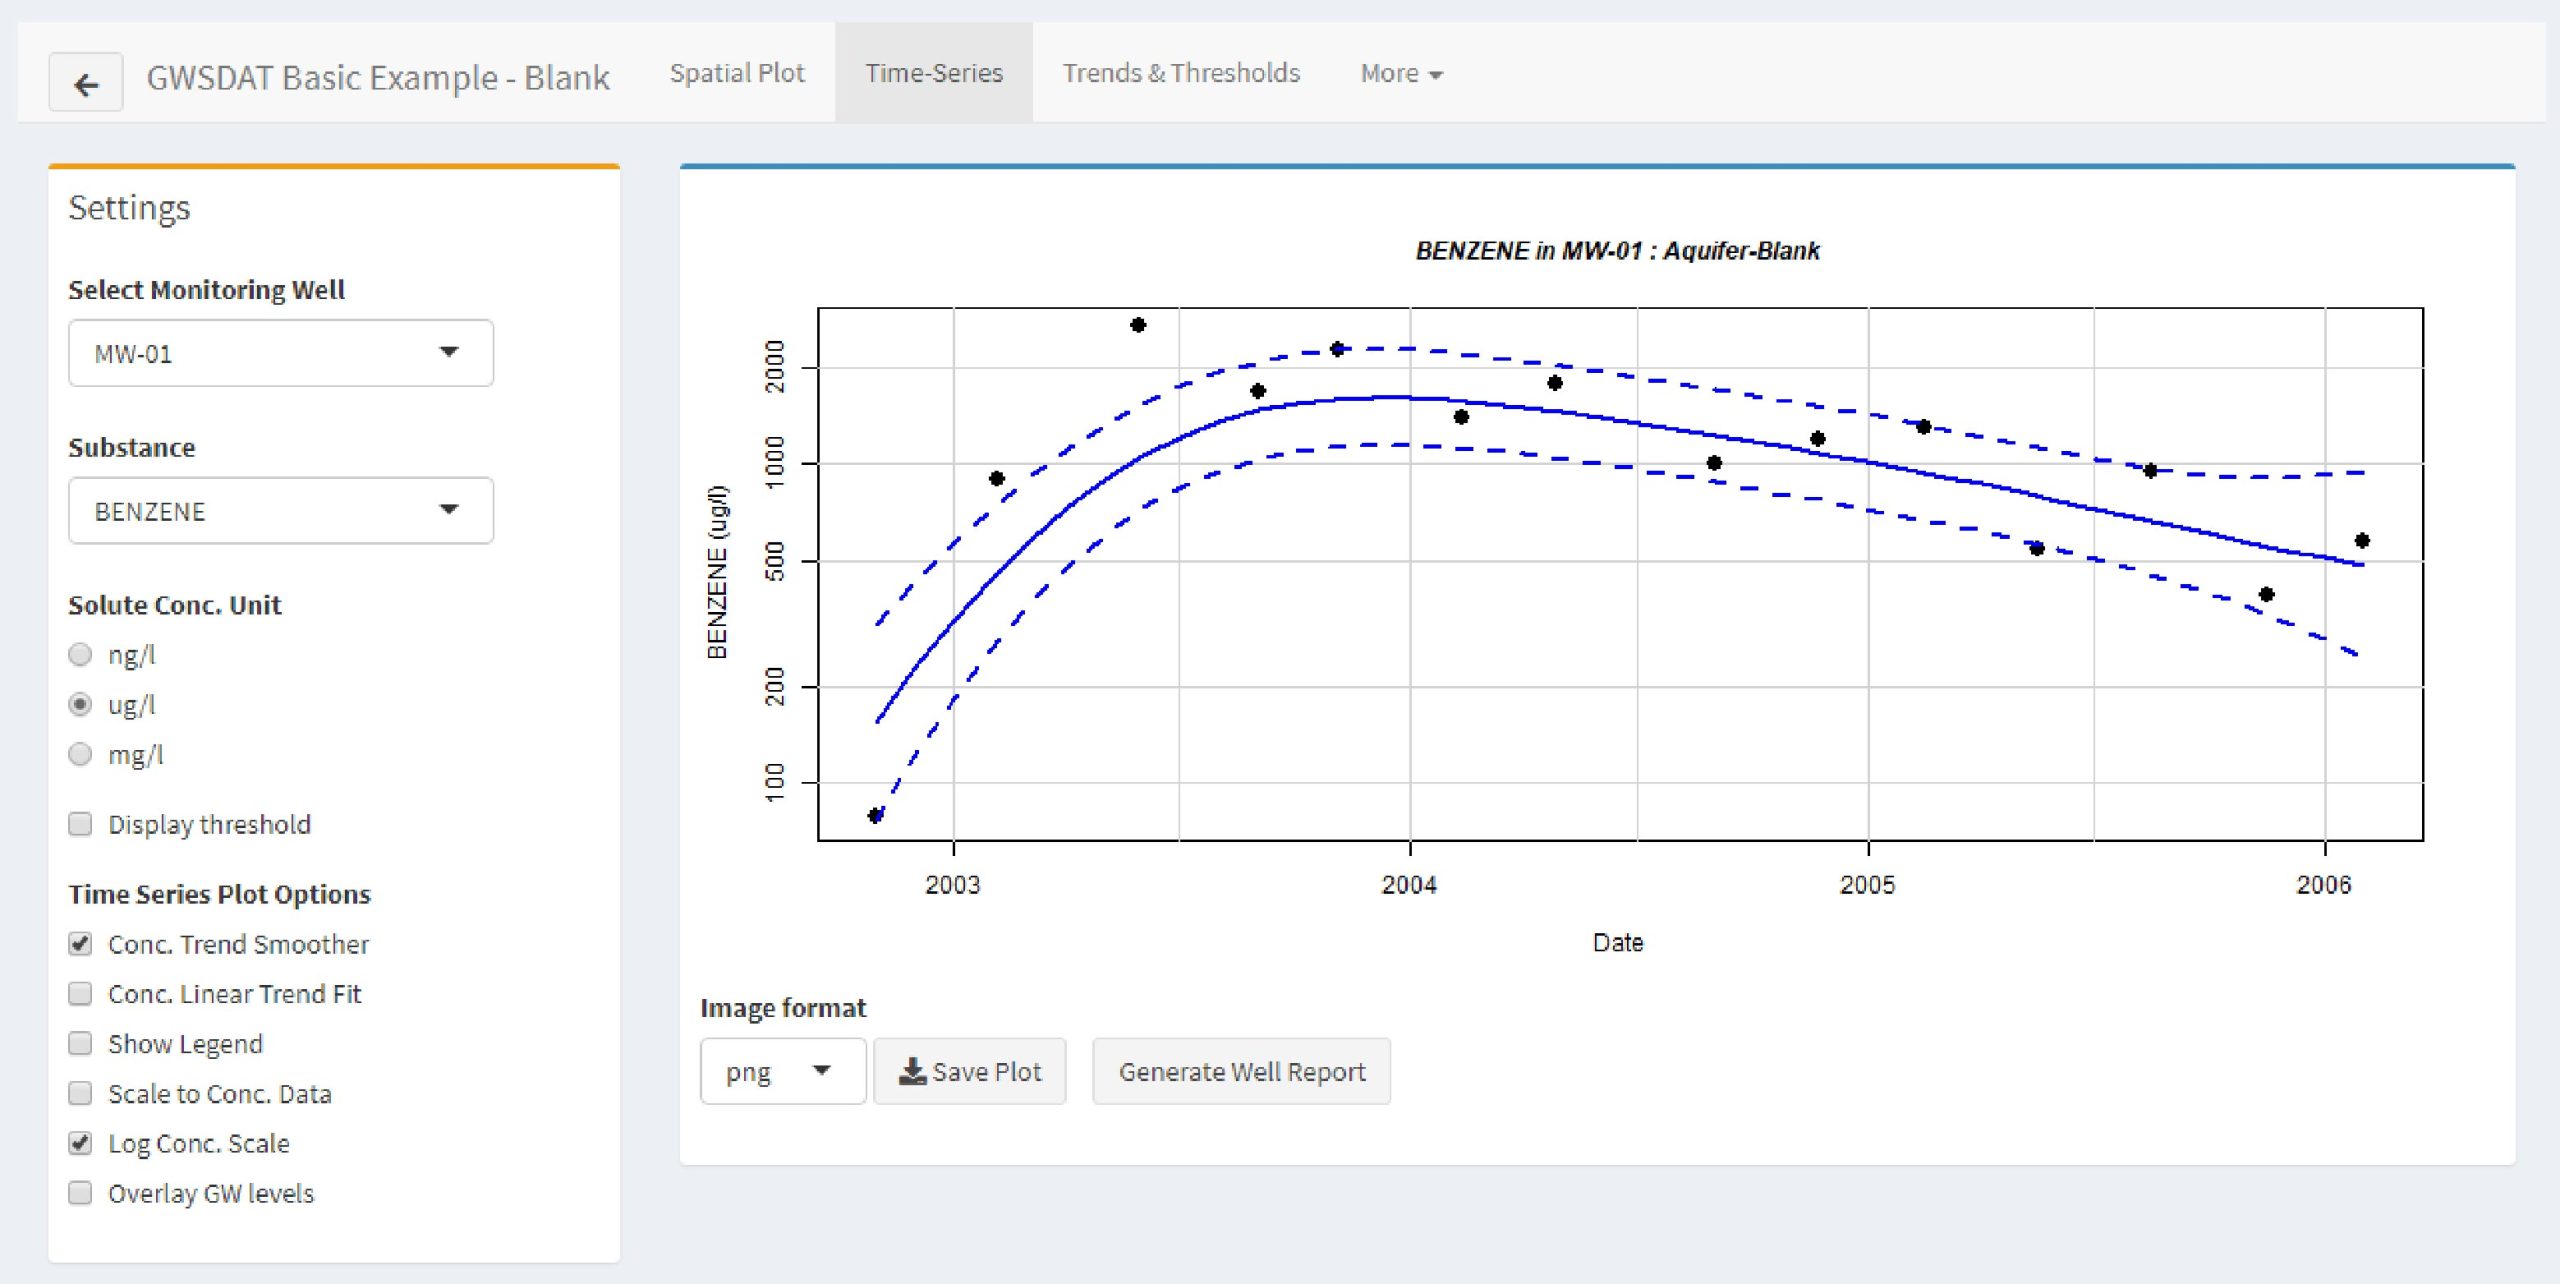
- Non-parametric trend estimate (Figure 13 of Jones et al. 2021; GWSDAT Manual version 3.1)
3. Nomographs for Source Depletion
Golder (2016 and 2021) Toolkits for Management of Petroleum Hydrocarbon Sites:
- Toolkit 1
Summary of Toolkits and Conceptual Site Model and Case Studies (July 8, 2016) - Toolkit 2
Monitoring and Prediction (July 8, 2016) - Toolkit 3
Evaluation of Remediation Technologies for Petroleum Hydrocarbon Sites (April 5, 2021) - Toolkit 4
Methods for Sustainable Remediation (April 6, 2021)
SR Dashboard
4. Groundwater Plume Stability Tools
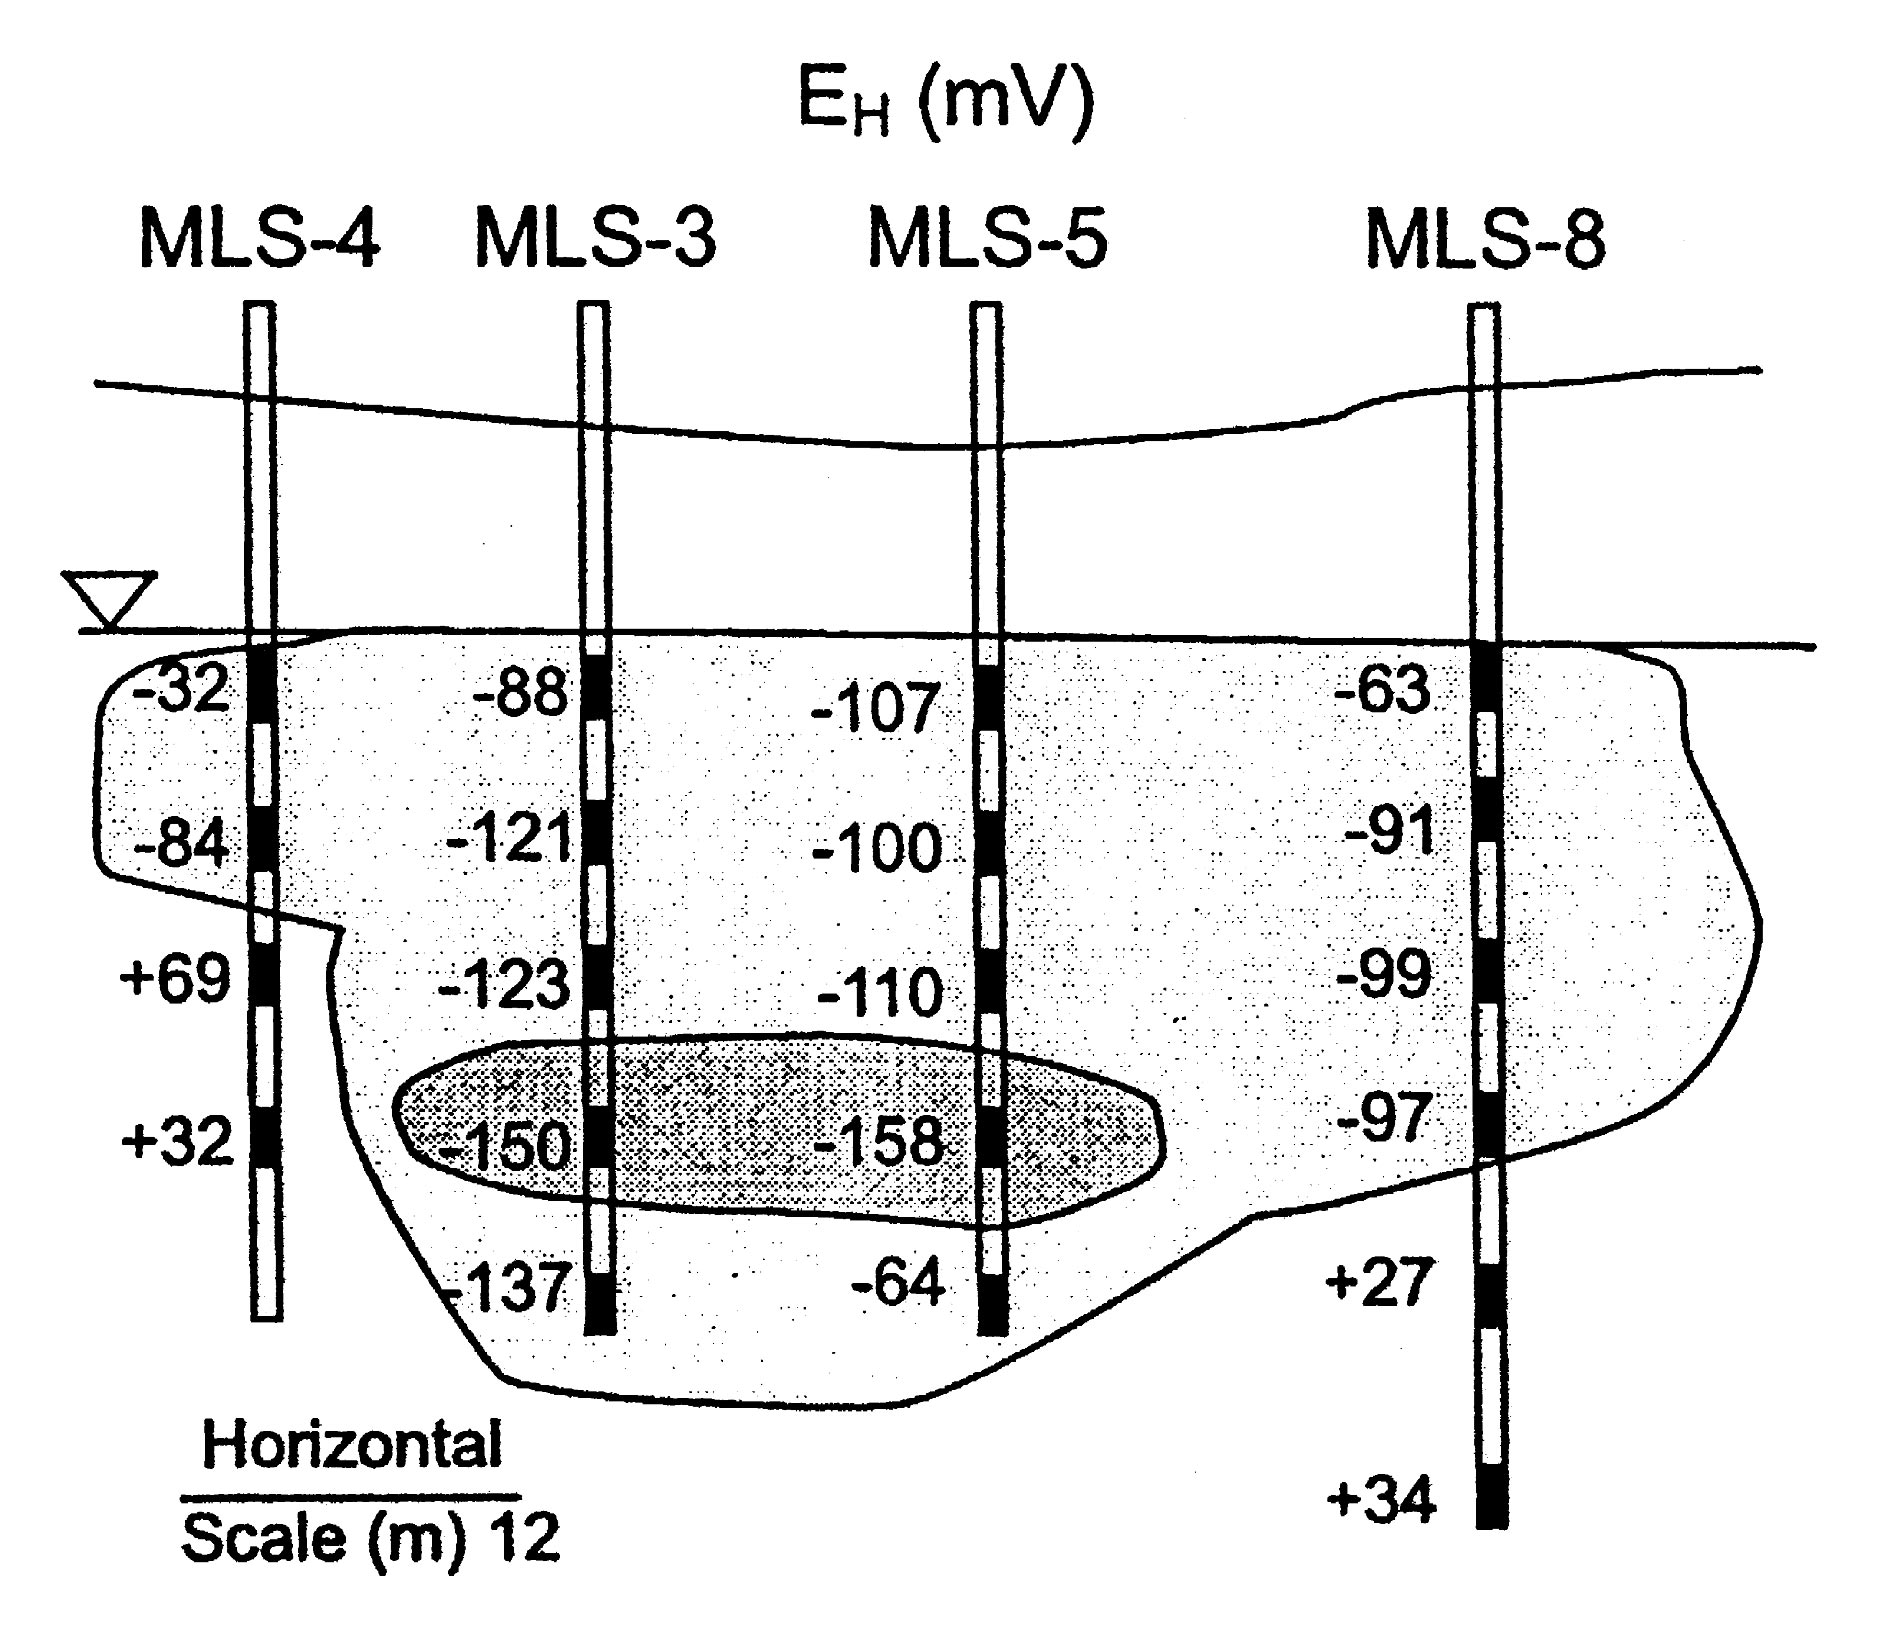
5. Geochemical Parameters to Demonstrate Biodegradation
- Field parameters and groundwater sample collection and analysis (Golder 2016 and Christensen et al. 2000)
- Qualitative comparison of the reactants and byproducts of biodegradation reactions within and upgradient of the groundwater plume
- Variations in redox potential within and upgradient of the groundwater plume
Qualitative assessment of biodegradation across the groundwater plume:
6. Groundwater Attenuation Rate Estimation Tools
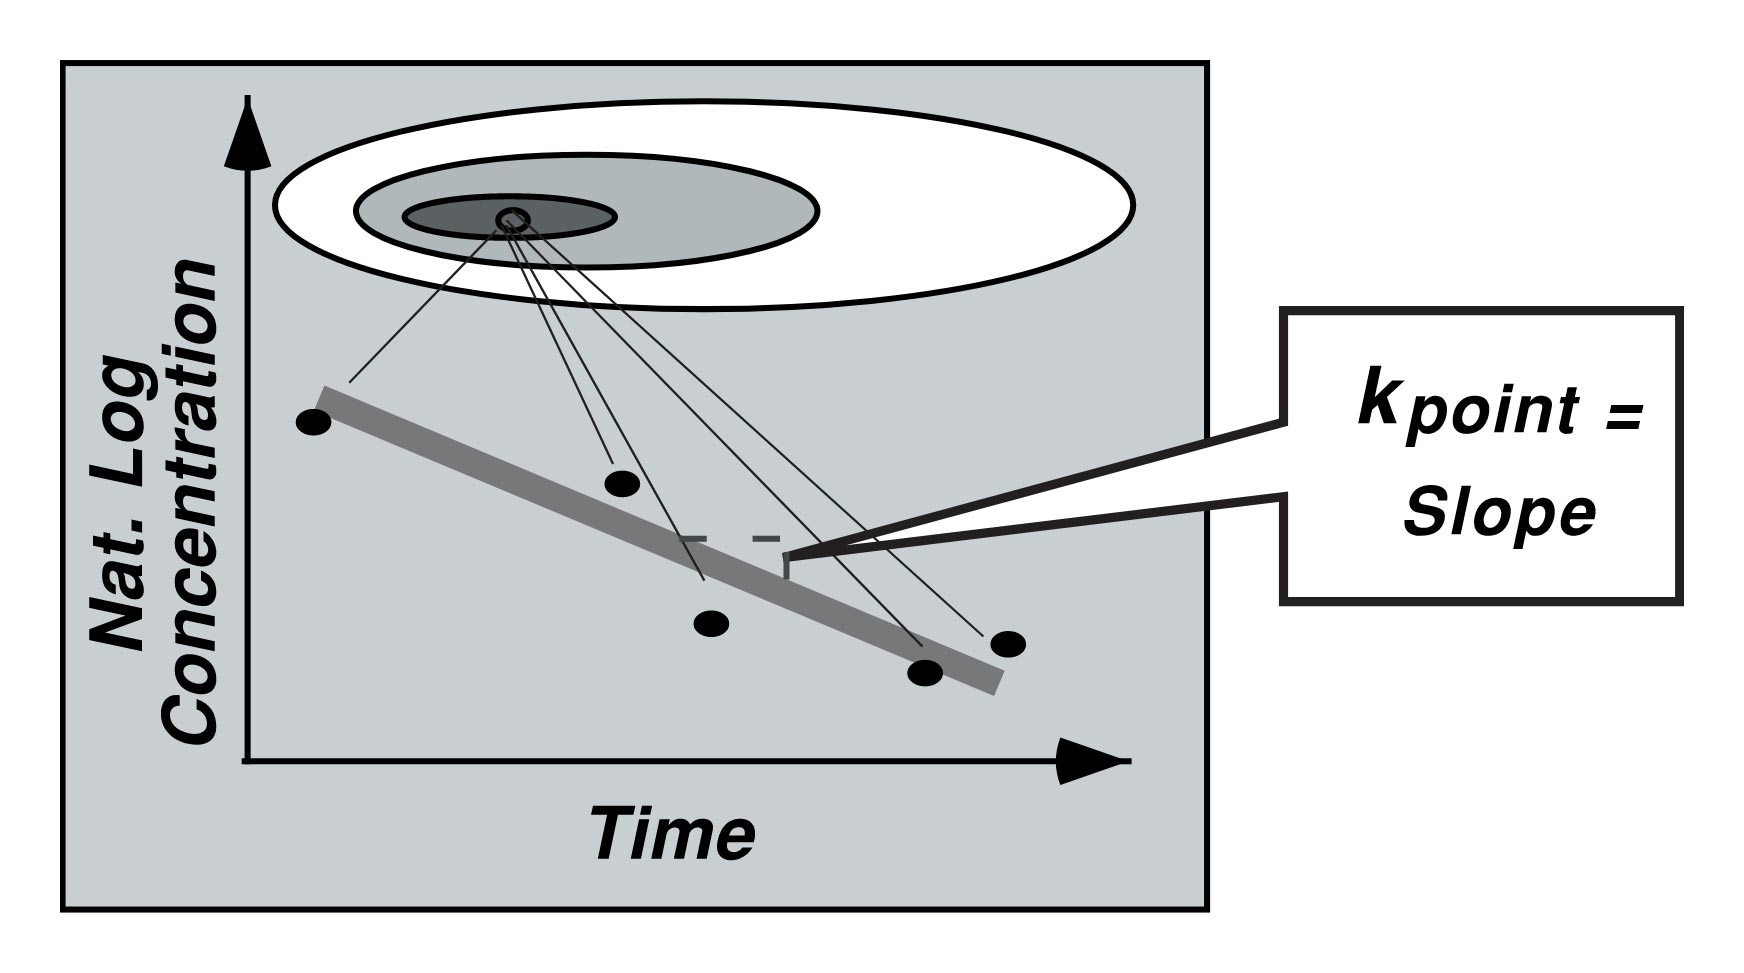
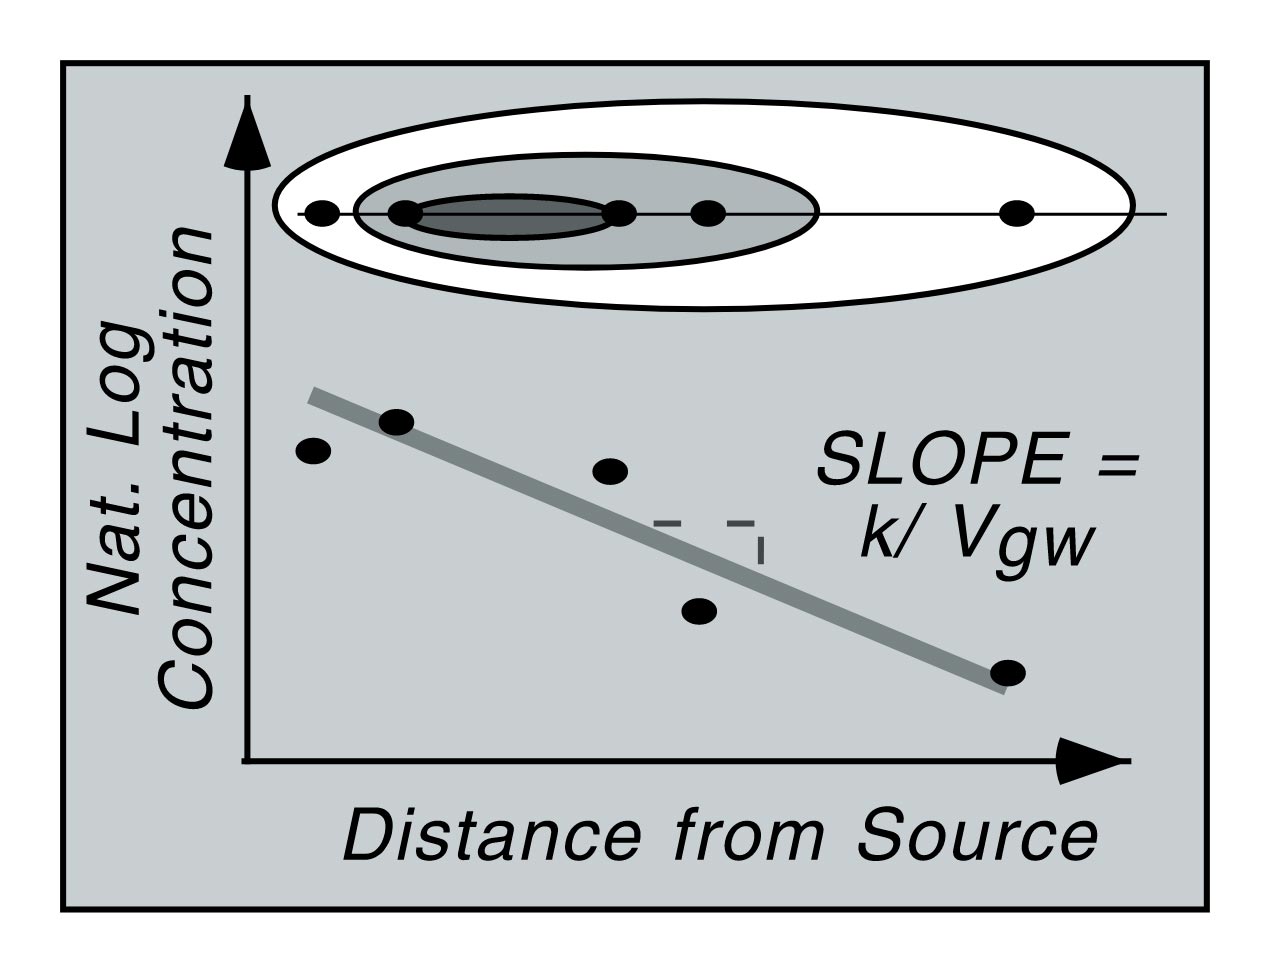
- Bulk attenuation rate that incorporates biodegradation, dispersion and sorption through analysis of concentration versus distance (kbulk) or concentration versus time, kpoint (Newell et al. 2002; Golder 2016; Enviro Wiki Page on MNA)
- Biodegradation or “biodecay” rate constant (
 ) estimated through model calibration/fitting and modeling of non-reactive tracer (ASTM 1998; Newell et al. 2002; Golder 2016)
- Kpoint can be used to estimate time to reach clean-up goal at single location; if applied to multiple locations over the plume, can be used to assess plume duration and trend
- Kbulk can be used to project the plume trend (expanding, stable or shrinking)
- can be used to predict the plume trend and for use in solute transport models
Estimation of rate constants that are statistically significant is difficult with fewer than six sampling dates or monitoring data in less than three years (Newell et al. 2002). It is also important to consider that the rates determined over a few years may change over longer timeframes like decades into the future.
Additional lines of evidence:
Trends and rates of mass-based estimates can also be used to improve decision making such as changes in time of mass discharge rates (Newell et al. 2002). Refer to Mass Discharge Estimation Tools (7) for available resources and guidance for estimating mass discharge rates. Mass-based estimates can be a more direct indicator of risk to receptors such as water supply wells or surface water bodies since they combine hydrogeological and concentration data. They can also be used to better understand the conceptual site model and the groundwater plume behavior.
7. Mass Discharge Estimation Tools
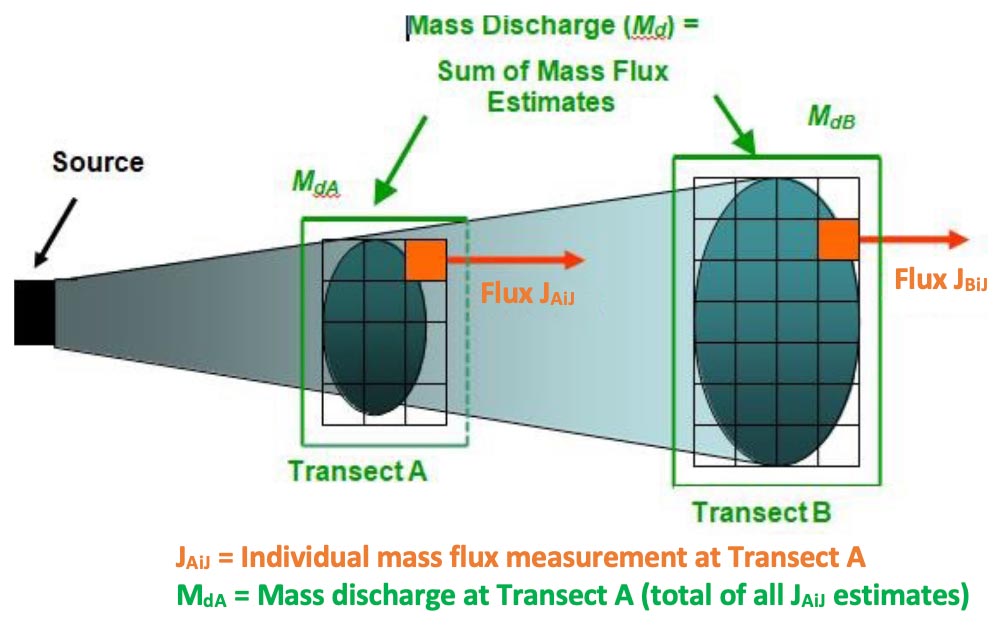
These mass-based estimates also complement concentration-based estimates of trends and COC attenuation rates as they take into account the hydrogeological conditions (5). Mass discharge rate is also referred to as contaminant mass discharge (CMD) (Truex et al. 2015). The rate is the sum of mass flux, or the integrated mass flux, across a transect plane perpendicular to the groundwater flow direction (F)3.
In scenarios where active remediation is used to mitigate risks associated with a groundwater plume, the mass-based estimates can be used to evaluate the risk to potential receptors and thereby guide the transition from active remediation to less resource intensive measures and/or MNA. Refer to Table 1-1 in ITRC (2010) for application of mass discharge rates in site remediation and management.
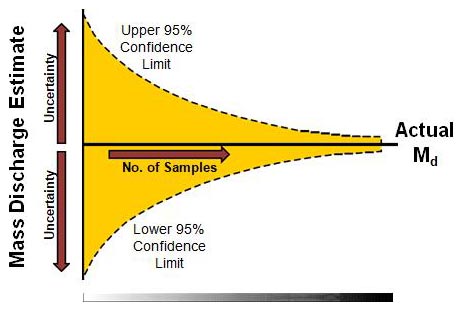
There are various recommended approaches as described in ITRC (2010):
- Transect method (most common approach, Farhat et al. (2011) Mass Flux Toolkit)1
- Using existing site data of concentrations and groundwater flow rates (or transects based on isocontours)
- Well capture/pump test method or integrated pump test (ITRC 2010 and Truex et al. 2015)
- Passive flux meters (ITRC 2010; Truex et al. 2015; Klammler et al. 2012; iFlux)
- Solute Transport Models (Table 4-3 of ITRC 2010)
8. Screening Level Source Depletion Rates
- Mass depletion rate by dissolution to groundwater
- Dissolved source zone mass depletion rate by biodegradation (Table 2-3 of Toolkits 2)
- Unsaturated source zone mass depletion rate by volatilization and biodegradation
9. Solute Transport Models
10. Numerical Models
A comprehensive review of models relevant to NSZD is provided in Sookhak Lari et al. (2019) and categorized by key geochemical process. Of the 36 models reviewed, only one third simulate volatilization, variably saturated media and NSZD in both the vadose and saturated zones.
Key relevant models are:
- PH3D – while it does not include volatilization and vadose zone processes, it is commercially available and notably includes direct outgassing from LNAPL and aqueous phase as demonstrated in the study of Ng et al. (2015)
- TMVOC – notably includes multi-phase transport (Sookhak Lari et al. 2018)
- MIN3P-Dusty – notably includes variably saturated media and various implementations of gas transport and a version of the code with gas bubble formation and ebullition
Example applications of the MIN3P-Dusty numerical model for petroleum hydrocarbon fate and transport: 1. Molins et al. (2010) Vadose zone attenuation of organic compounds at a crude oil spill site — Interactions between biogeochemical reactions and multicomponent gas transport; 2. Toolkits 2 (Section 4 along with the solute transport models); 3. Jourabchi and Hers (2013) on modeling study of iron and manganese in groundwater from a PHCs (benzene) source.
11. Evaluating Remediation Performance
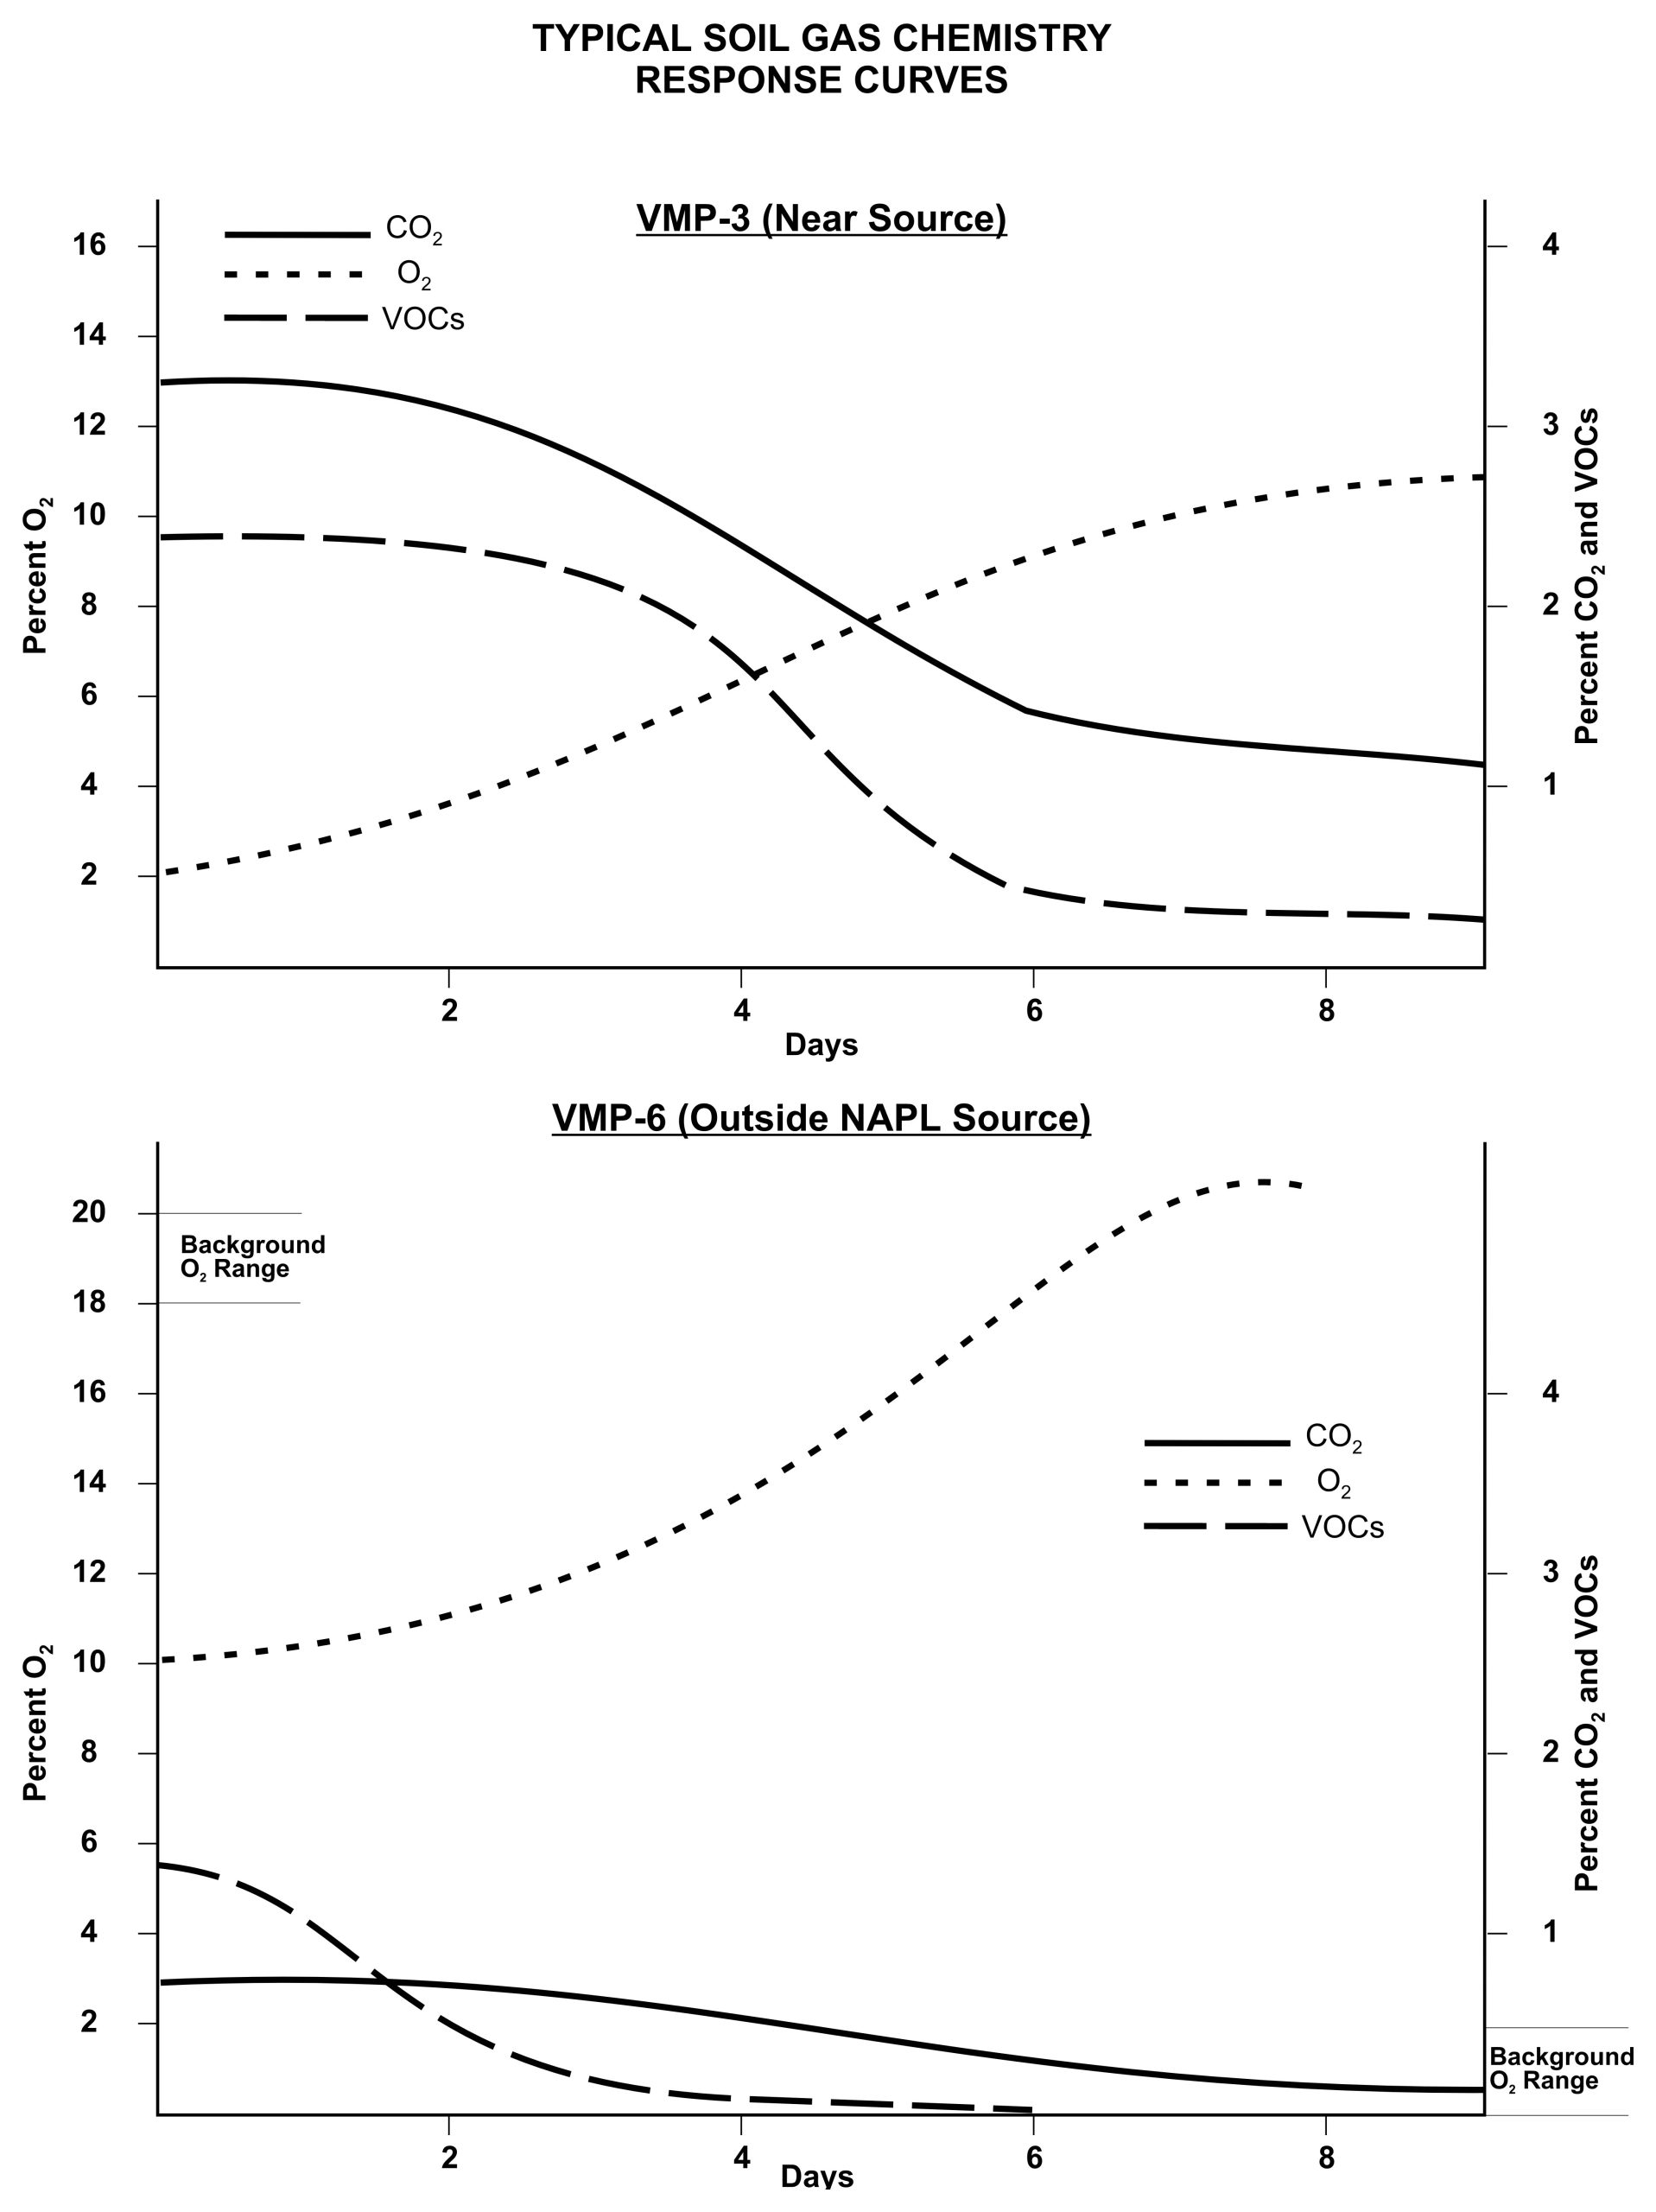
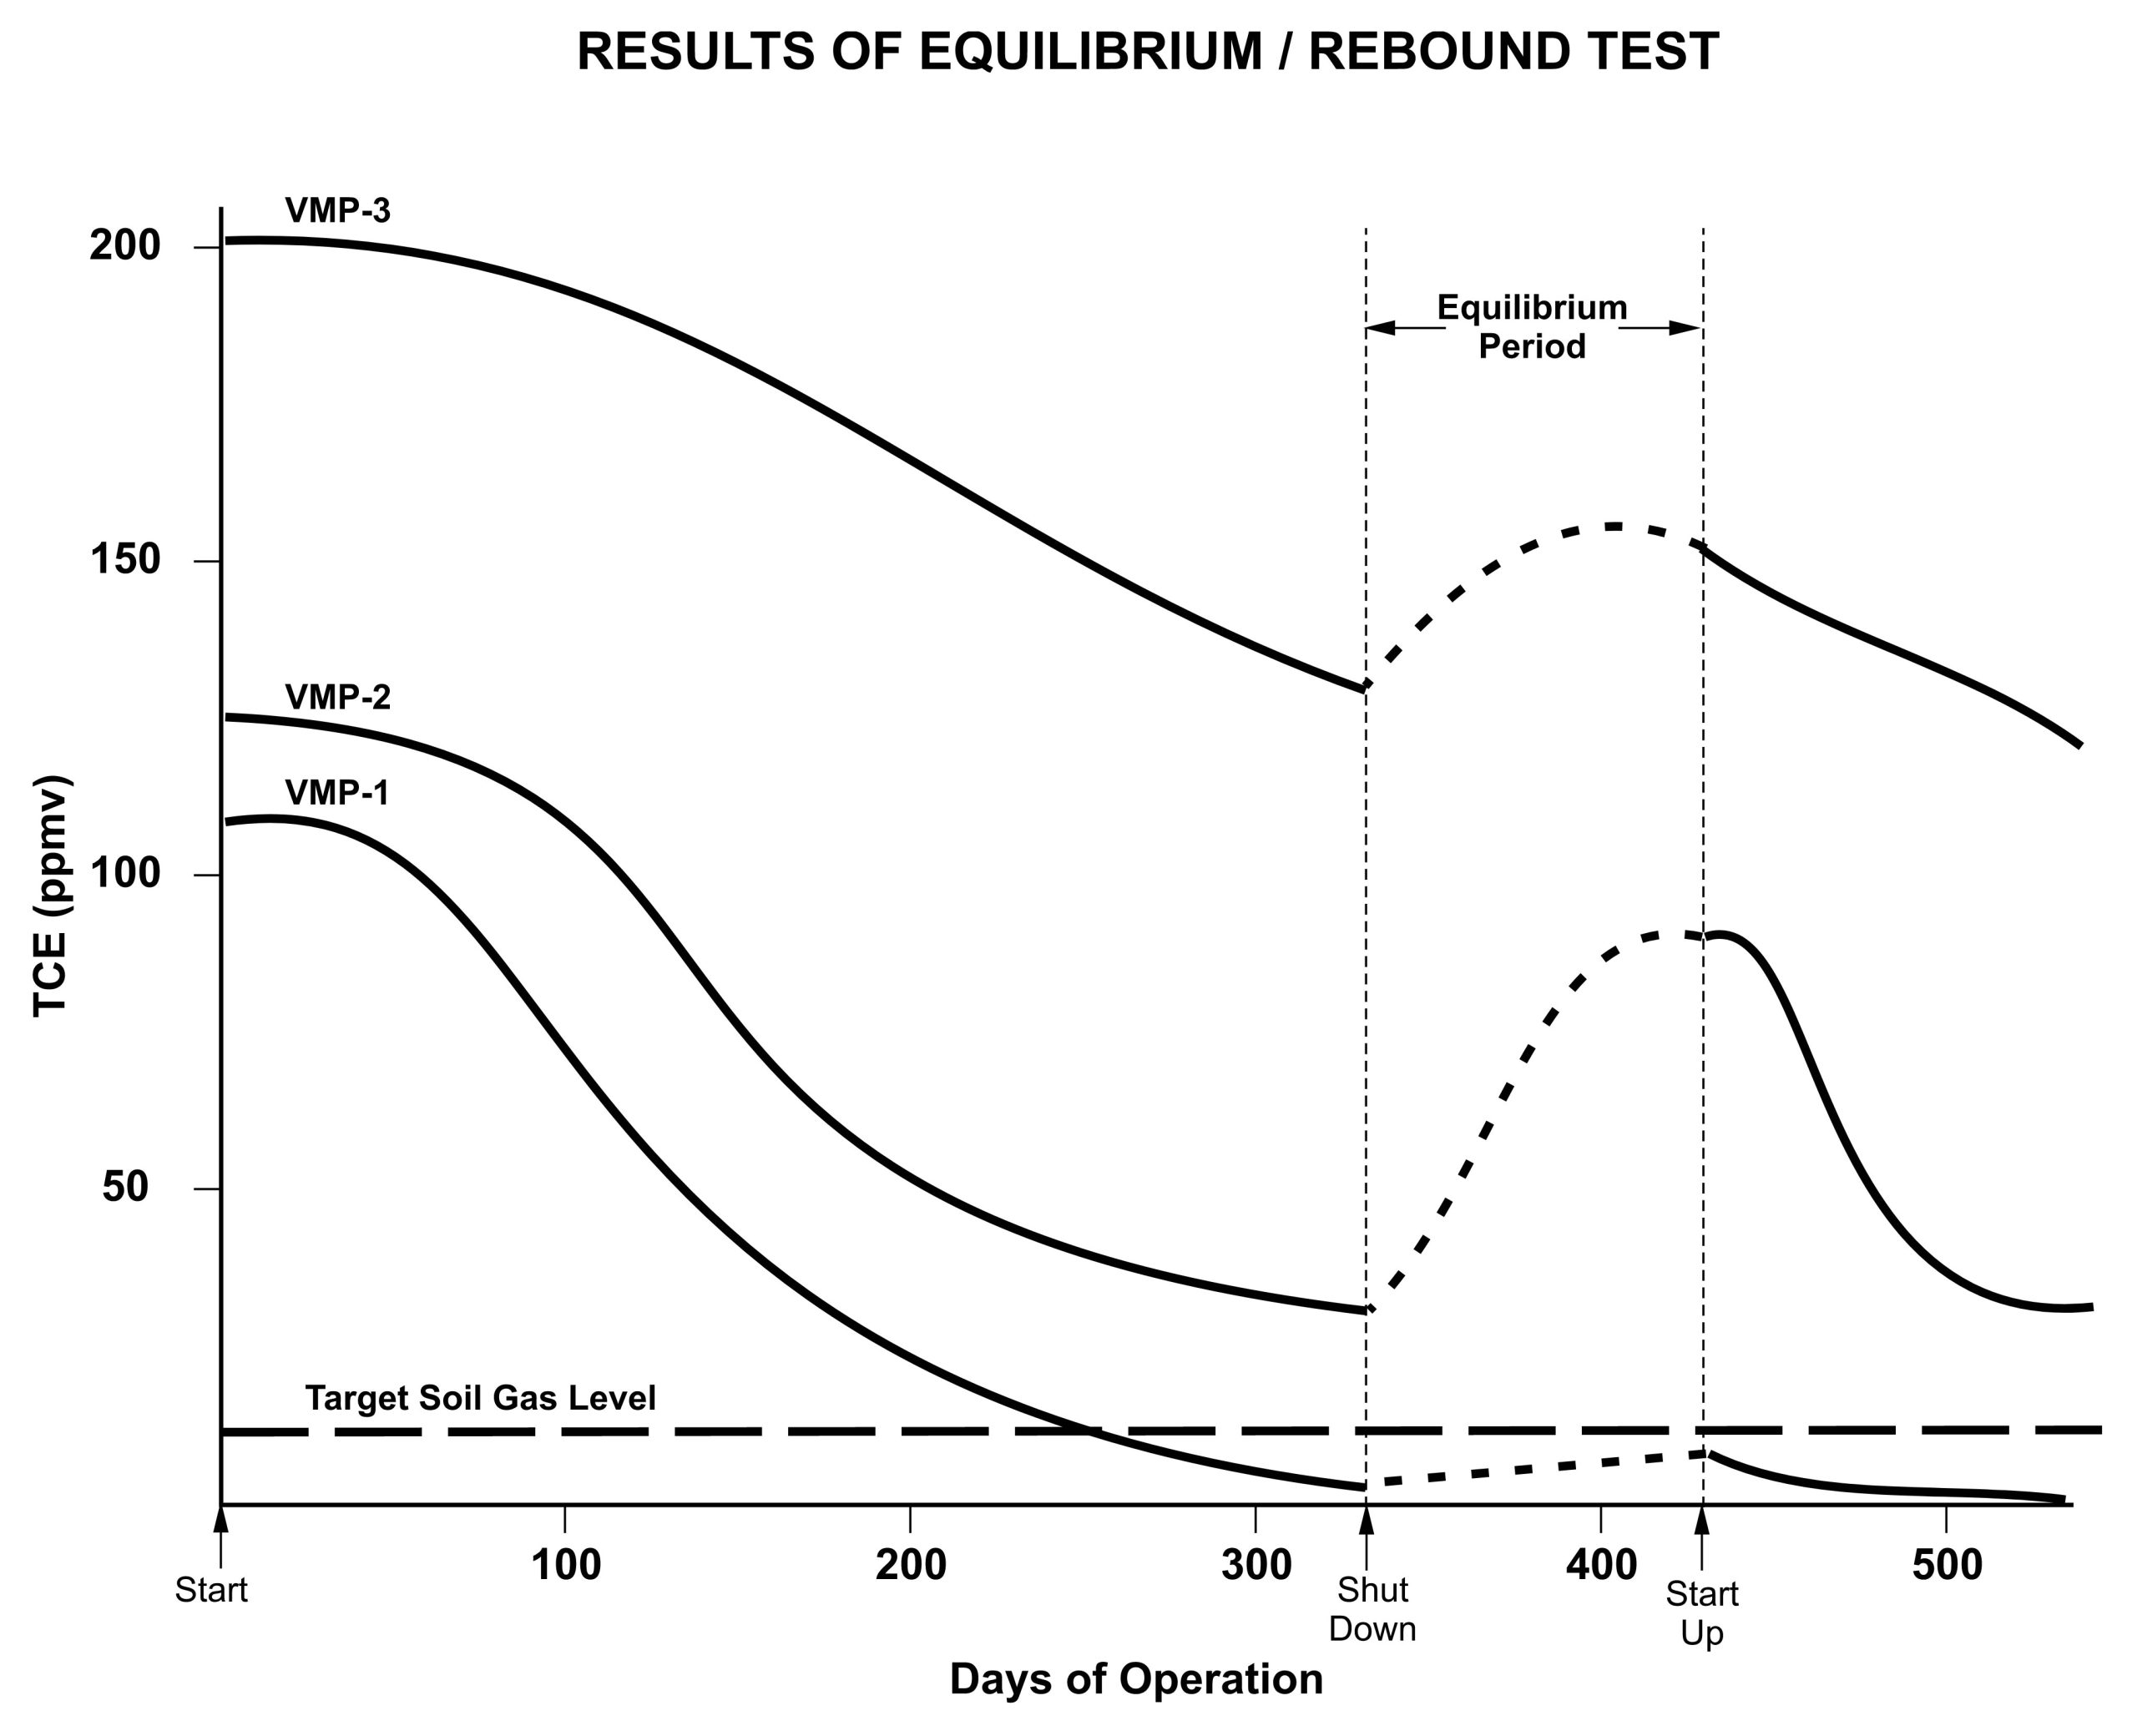
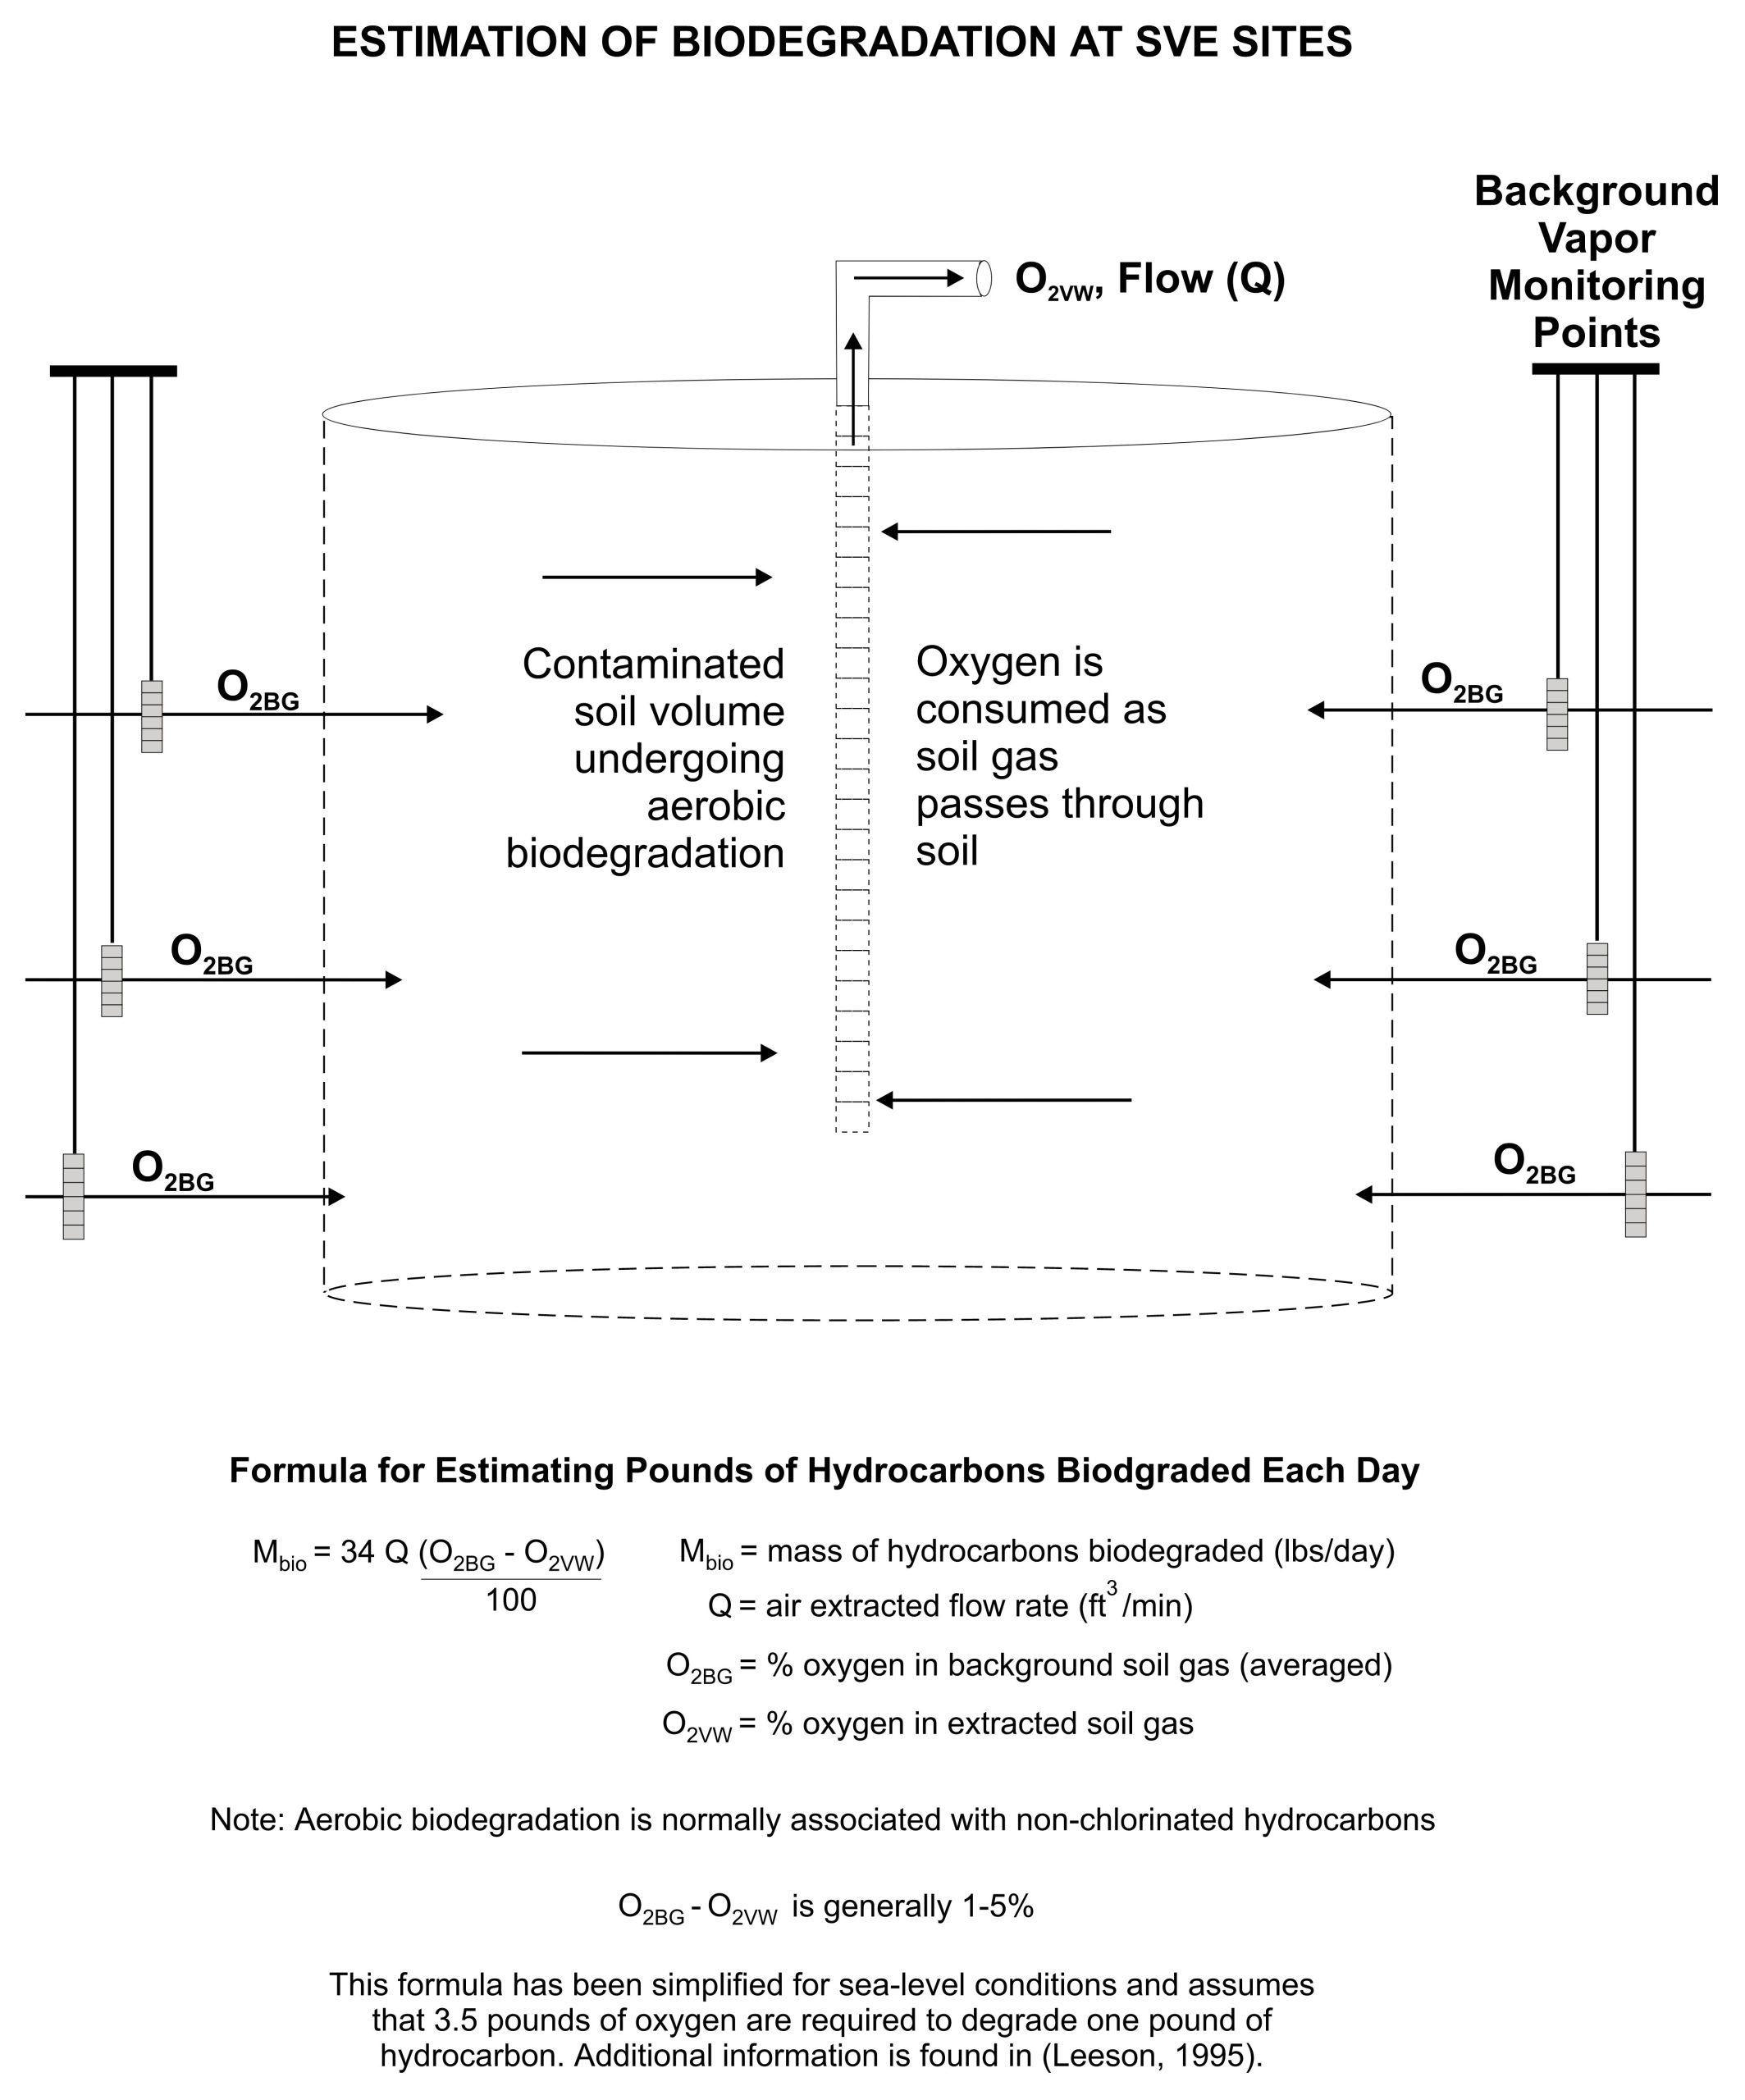
- US AFCEE (2001) note the importance of collecting VOC concentration data and time period to reach equilibrium concentrations after system shut-off for rebound/equilibrium testing. Respiration tests can also be used to estimate the mass of contaminants that are being biodegraded and removed from the soil during SVE operation.
- Truex et al. (2013)
- Combination of VOC rebound testing with mass removal rates (Compendium and SVE Factsheet)
- Assessment of monitored natural attenuation (MNA) as described in Section 6.2.1 of Truex et al. (2015): estimates of attenuation rates to evaluate threshold concentrations or comparison of contaminant mass discharge (CMD) to attenuation capacity.
Step 1. Identify the remedial action objective (RAO) concentration goal (CRAO) at a selected maximum downgradient plume migration distance, d (i.e., the maximum downgradient plume migration distance acceptable as a zone of MNA with no impact to receptors or other downgradient constraints like property boundaries)
Step 2. Estimate the concentration-based attenuation rate in the downgradient plume (e.g., in units of mg/L/day) (see Groundwater Attenuation Rates (6) for bulk attenuation rate, kbulk)
Step 3. Estimate the contaminant transport velocity (Vcontaminant)
qnatural = the Darcy flux (hydraulic conductivity × hydraulic gradient) under natural (non-pumped) conditions
n = effective porosity
Rcontaminant = the retardation factor for the contaminant
Depending on the available data at a site, Truex et al. (2015) recommend one of three options for calculation of the post P&T CMD:
ii. Post-P&T CMD = (qnatural x Asource zone / QP&T) x CMDP&T
iii. Post-P&T CMD = Csource x qnatural x Asource zone
CP&T = COC concentration from the P&T extraction system for the wells used in the analysis
qnatural = the Darcy flux (hydraulic conductivity × hydraulic gradient) under natural (non-pumped) conditions
Acapture cross section = cross sectional area that is captured by the P&T wells used in the analysis
Asource zone = cross sectional area of the source zone through which groundwater under a natural gradient would flow
QP&T = P&T extraction flow rate for the wells used in the analysis
CMP&T = CP&T / QP&T
Csource = COC concentration selected to represent the source zone (or plume upgradient of the P&T system, which can be a maximum observed concentration or an average of some designated areas
The post-P&T CMD can be used in an MNA evaluation considering any continuing sources such as from matrix diffusion that persist after termination of P&T.