Appendix I – SVE Technology Description
ESTCP (2002) Air Sparging Design Paradigm
- Site characterization and development of site conceptual model
- Preliminary feasibility assessment
- Pilot testing
- Design
- Monitoring
The pilot testing is divided into two approaches, 1) standard design approach and 2) site-specific design approach. For each of these two approaches there are default designs and recommended monitoring. The flow chart for air sparging design including pilot testing is shown in Figure B-1.
The standard design approach recommends the following data collection: injection pressure versus flow rate test, transient pressure response test, dissolved oxygen measurements, helium tracer test and soil gas sampling. Based on this data set, injection wells based on 15 ft centers and 20 ft3/min injection rate are recommended. The site-specific design approach recommends the standard methods plus sulphur hexafluoride tracer test to assess air distribution more accurately.
Overview of Technology
The phase change and mass removal typically decrease during the treatment life cycle. During early stages of remediation, the primary mass removal is from air pathways of low resistance (higher permeability soils), where chemicals in adsorbed phase or non-aqueous phase liquids (NAPL) partition into the moving air. Contaminants in lower permeability soils will not be removed by advection because soil vapors will preferentially flow through higher permeability soils. When the mass in higher permeability soils becomes mostly depleted, the rate of mass removal may approach a low value or cumulative mass recovery may approach an asymptotic value. This is because contaminants in lower permeability silts and clays and within the capillary fringe, if present, must desorb and diffuse into an advective flow path before they can be removed by the SVE system. If the rate of diffusion is slow, the time duration for removing VOCs may be significantly extended (US EPA 1991). US EPA (2018) describes a two-compartment model (coarse- and fine-grained) for prediction of concentrations and clean-up times when there are mass transfer limitations resulting from slow diffusive transport in fine-grained soil layers.
The addition of air through SVE may result in enhanced aerobic biodegradation and consequently SVE is closely related to bioventing (refer to Bioventing Factsheet). Because there is often contamination at or below the water table, remediation through air sparging will often be an additional component to the SVE system.
Exit Strategy Toolkit
Hydraulic Recovery Factsheet
This factsheet provides information to support remedial decision-making on LNAPL hydraulic recovery. The information is intended to help:
a) optimize the performance of hydraulic recovery; and,
b) confidently transition from hydraulic recovery to another active remedy, natural attenuation, “no further action”, or site closure.
This factsheet should be read in conjunction with the overarching Compendium Factsheet, which provides a broader context for application of hydraulic recovery within a framework for remedial decision making.
This factsheet is not intended to provide detailed guidance on hydraulic recovery and assumes that a sufficiently detailed LNAPL conceptual site model (LCSM) has been developed and hydraulic recovery has been selected as an appropriate technology to meet agreed remedial concerns and remedial objectives (Appendix I and Appendix II). Additional details on hydraulic recovery design and implementation can be found in US EPA (2005), NAVFAC (2010), CL:AIRE (2014), CRC Care (2015), API (2018) and ITRC (2018). The information found in the appendices and reference materials can be extremely helpful in supporting remedy implementation and facilitating the acceptance of risk-based approaches.
Hydraulic Recovery - Technology Summary
Skimming: LNAPL is removed under natural gradients at the air/LNAPL interface air using a pump or similar continuous mechanical device (e.g., pneumatic skimmer).
Vacuum Enhanced Skimming: LNAPL and vapor are removed. The removal of these fluids creates an LNAPL gradient which induces the flow of LNAPL to an extraction well where LNAPL is skimmed from the groundwater surface. Induced vacuum extracts LNAPL vapor from the unsaturated zone and capillary fringe. The technology is also referred to as bioslurping or vacuum enhanced fluid recovery (VEFR).
Total Liquid Extraction: LNAPL and water are removed. Fluid drawdown creates a LNAPL gradient toward the recovery point where both LNAPL and groundwater are recovered. This technology is also referred to as dual pump liquid extraction (DPLE) or vacuum enhanced groundwater extraction (VEGE).
Multi-Phase Extraction (MPE): LNAPL, water, and vapor are removed. LNAPL drawdown, groundwater drawdown, and vacuum induce an LNAPL gradient toward the recovery point.
Enhanced methods for LNAPL recovery include water flooding, surfactant-enhanced subsurface remediation (SESR) and cosolvent flushing. Additional information on hydraulic recovery approaches is provided in Appendix II.
Remedial Concerns and Objectives
Remedial concerns and goals at sites where hydraulic recovery is implemented often shift over time to be composition based (e.g., reducing the total mass of petroleum hydrocarbons (PHCs) or constituents of concern (COCs) below risk-based clean-up levels). Continued application of hydraulic recovery will not be successful in such cases. Composition-based concerns can be factored into remedial decision-making during or following the onset of hydraulic recovery. Broader remedial decision making should also factor in potential liabilities associated with site risk, regulatory requirements, business plans and timelines, future redevelopment potential, sustainability, and economic factors. The remedial objectives should also incorporate the notion of technical practicability.
Performance Metrics
Performance metrics are established to optimize remedy performance and gauge progress toward a transition threshold (discussed later) or remedial objective. Performance metrics can be broadly classified as system or subsurface related (see Table 1 and Figure 1 in the Compendium Factsheet). Performance metrics to address migrating LNAPL should include direct indicators, such as the presence/absence of LNAPL in wells (LNAPL body extent), and indirect lines of evidence such as LNAPL recovery, LNAPL transmissivity, and natural source zone depletion (NSZD) rate (CL:AIRE 2014; ITRC 2018, Strasert et al. 2021). Performance metrics to address migrating LNAPL should include indicators such as LNAPL transmissivity and LNAPL saturation. LNAPL transmissivity is the primary metric for source reduction and is an indirect proxy for LNAPL stability (ITRC 2018). Metrics should be established and agreed upfront by all key stakeholders before hydraulic recovery is implemented. Data to assess the performance of hydraulic recovery can be collected before, during, and after remedy implementation.
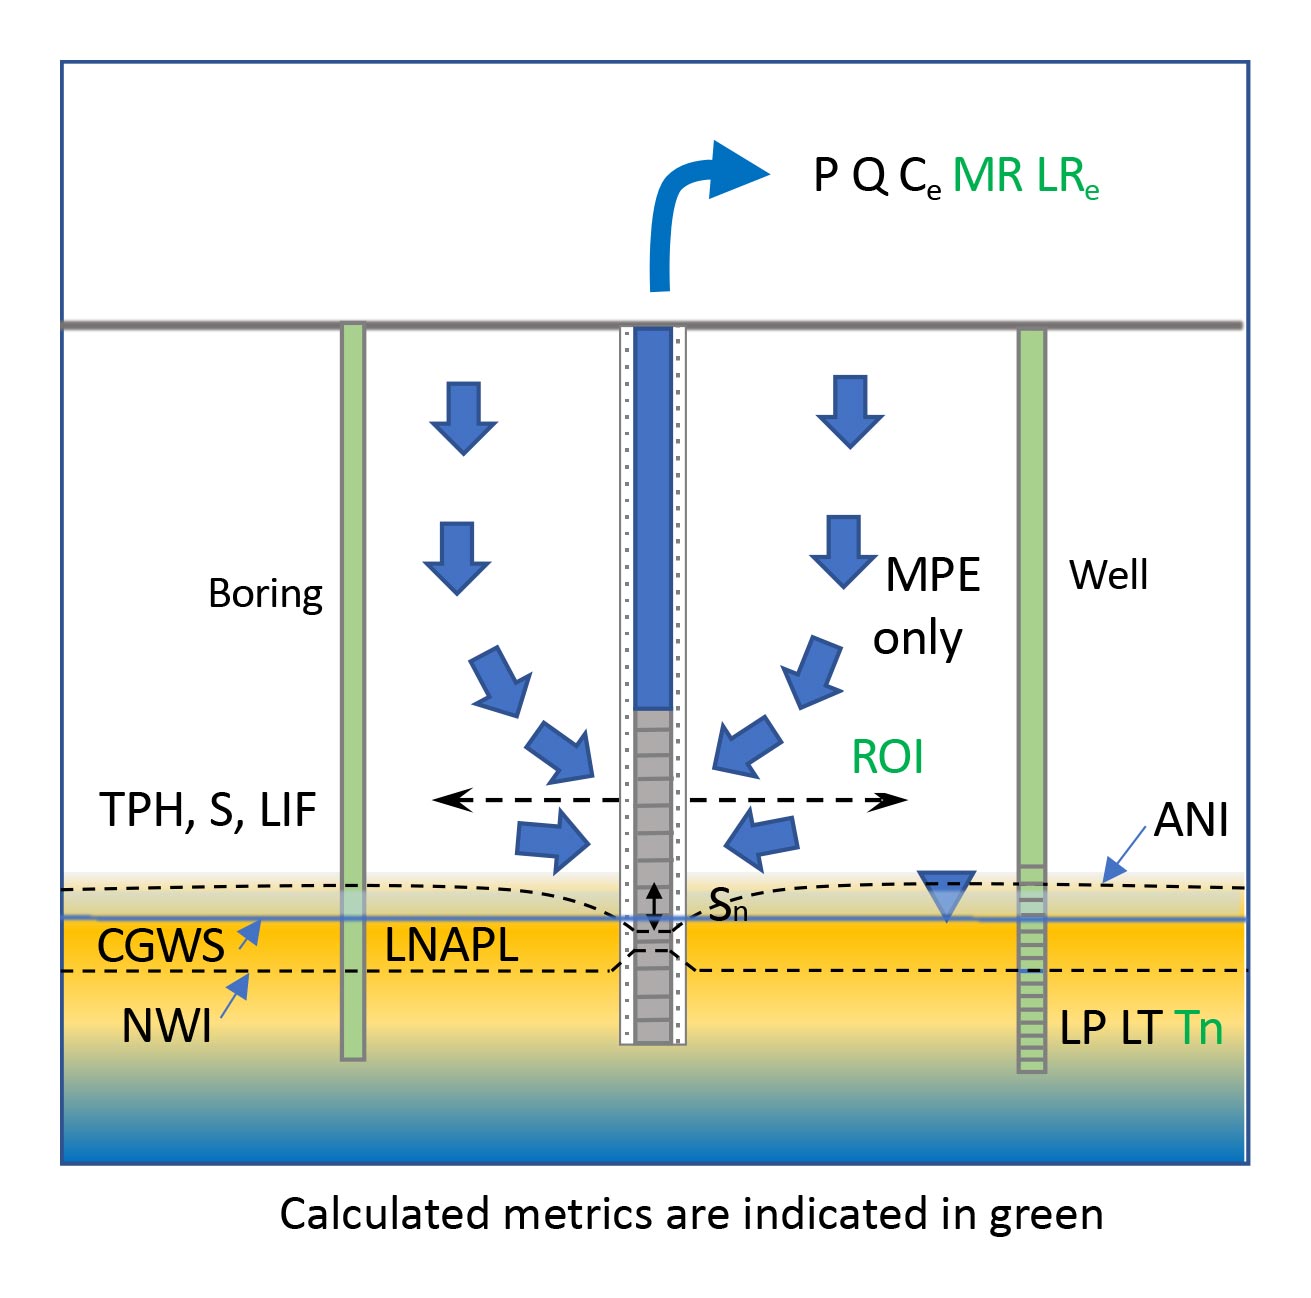
Performance Metrics
- LP = LNAPL presence
- LT = LNAPL thickness
- Tn = LNAPL transmissivity
- TPH = total petroleum hydrocarbon (TPH) concentration in soil (optional)
- S = LNAPL saturation in soil (optional)
- ROI = radius (or zone) of influence
- LIF = Laser induced fluorescence (LIF) profile (optional)
System:
- Q = Fluid recovery rates (LNAPL, water, gas)
- Ce = Hydrocarbon concentrations in extracted gas and/or water
- MR = Mass removal rate (Q x Ce)
- LRe = LNAPL to water or vapour ratios (unit volume of LNAPL per unit volume water or air)
- P = Pressure
- Sn = Drawdown
System Metrics
- LNAPL transmissivity estimated from system data (e.g., ratio of LNAPL to water in recovered fluids)
- LNAPL stable footprint based on absence in sentinel wells or potential discharge points such as seepage faces
- LNAPL mobile fraction remaining is below threshold of concern, i.e., primarily residual LNAPL
- Fluid recovery rates, which depending on system, may include rates of LNAPL, water and/or gas recovery at individual extraction wells and the system header
- Total PHC concentrations in extracted water and gas
- PHC mass removal rates obtained from volume of LNAPL recovered and calculated from water and gas flow and PHC concentrations in water and gas (flow multiplied by concentration) at individual extraction wells and the system header
- Ratio of LNAPL to water recovery at extraction wells and the system header (unit volume of LNAPL per unit volume of water recovery)
- Ratio of LNAPL to vapor recovery at extraction wells and the system header (unit volume of LNAPL per unit volume of vapor)
- Pressures for vacuum-enhanced recovery at individual extraction wells, the system header, and monitoring points
- Water level mounding at extraction wells when system is on as system performance may be reduced when there is mounding
- Air treatment metrics such as consumption of thermal oxidizer assist gas for multi-phase extraction
LNAPL Transmissivity
Subsurface Metrics
- LNAPL transmissivity estimated from tests in wells
- LNAPL thickness in wells (primarily to develop the LCSM)
- LNAPL presence/absence in wells or potential discharge points such as seepage faces
- Soil TPH concentrations and/or LNAPL saturations measured in soil cores (optional)
- Laser induced fluorescence (LIF) (optional)
- Soil vapour concentrations in wells or probes (optional)
The presence/absence of LNAPL and LNAPL thicknesses in an appropriately designed well network with wells screened across the water table at a reasonable spacing can provide valuable information on LNAPL footprint and stability. It is important to note, however, that the presence/absence of LNAPL and LNAPL thicknesses fluctuate with seasonal changes in the groundwater table elevation and whether LNAPL exhibits unconfined, confined conditions, or perched behavior (ITRC 2018). Specifically, the monitoring frequency and data interpretation should account for potential increases in LNAPL thicknesses at low water table conditions for unconfined or perched aquifer conditions and increases in LNAPL thickness for confined aquifer conditions.
LIF profiles can also be highly informative in characterizing the LNAPL distribution as part of the development of the LNAPL LCSM. LIF may also provide high resolution data on reduction in saturation at sites where the LIF response can be correlated to LNAPL saturation. The strength of LIF testing is primarily in developing the LCSM and not as a direct indicator of hydraulic recovery and consequently is an optional test.
Modeling Tools
Tools developed by API to assist with analyzing the efficacy of hydraulic recovery include:
- API LNAPL Distribution and Recovery Model (LDRM) (API 2007). This tool is based on a vertical equilibrium model using knowledge of the soil and LNAPL properties as input. The model can be used to predict the LNAPL distribution and performance of hydraulic recovery for various technologies including single- and dual-pump wells, skimmer wells, vacuum-enhanced wells, and trenches.
- API LNAPL Transmissivity Workbook (API 2016). This workbook includes a Microsoft Excel™ spreadsheet tool that can be used to analyze results from baildown tests using multiple methods.
Other, more sophisticated multiphase flow numerical codes are available (e.g., TMVOC, STOMP, UTCHEM) but are rarely used because of their complexity and challenges for parameter estimation. The LA LNAPL Working Group (2011) provides a review of available models that includes calculations for LNAPL transmissivity, seepage velocity and relative permeability. RTDF (2005) also provided a model review that includes case studies.
Other Considerations
- Time
- Cost (e.g., $/kg LNAPL recovered)
- Greenhouse gas emissions (GHG) or other quantifiable sustainability metrics (e.g., kg CO2 emissions/kg LNAPL recovered)
- Ratios of mass removal through different processes including LNAPL, soil vapor and water in extracted fluids and subsurface biological processes (see Bioventing Factsheet)
Additional information on hydraulic recovery optimization is provided in Appendix IV.
Transition Thresholds
The decision to terminate active recovery requires confidence (multiple lines of evidence – MLE) that the LNAPL body is stable and/or that LNAPL has been remediated to a practical limit. Given the importance of LNAPL stability, it is identified as the first transition threshold or “tollgate”. If the remedial objectives for migrating or mobile LNAPL have not been met, operation of the active system should continue, and optimization measures considered (Appendix IV).
Limits of LNAPL Recovery
A key attribute of hydraulic recovery systems is that rates of LNAPL recovery typically decrease over time following a first-order decay rate where total recovery asymptotically approaches the fraction of continuous LNAPL present (API 2018). This decline is a consequence of the removal of mobile LNAPL and the associated and unavoidable entrapment of LNAPL that subsequently occurs because water is the wetting fluid and preferentially migrates into the smaller pores causing a constriction of LNAPL flow paths and eventually a discontinuous network for LNAPL flow (API 2018). Weathering and smearing of the LNAPL can also contribute to the decline in recoverable LNAPL. A key implication is that LNAPL pumping results in decaying recovery rates with time and at best fractional mobile LNAPL depletion (API 2018) and where often natural depletion rates (Garg et al. 2017) exceed later-stage active recovery rates (Palaia 2016). The recovery lifecycle, while site-specific, can occur over short time spans meaning active remedy termination should be considered sooner in the process than in the often typical practice.
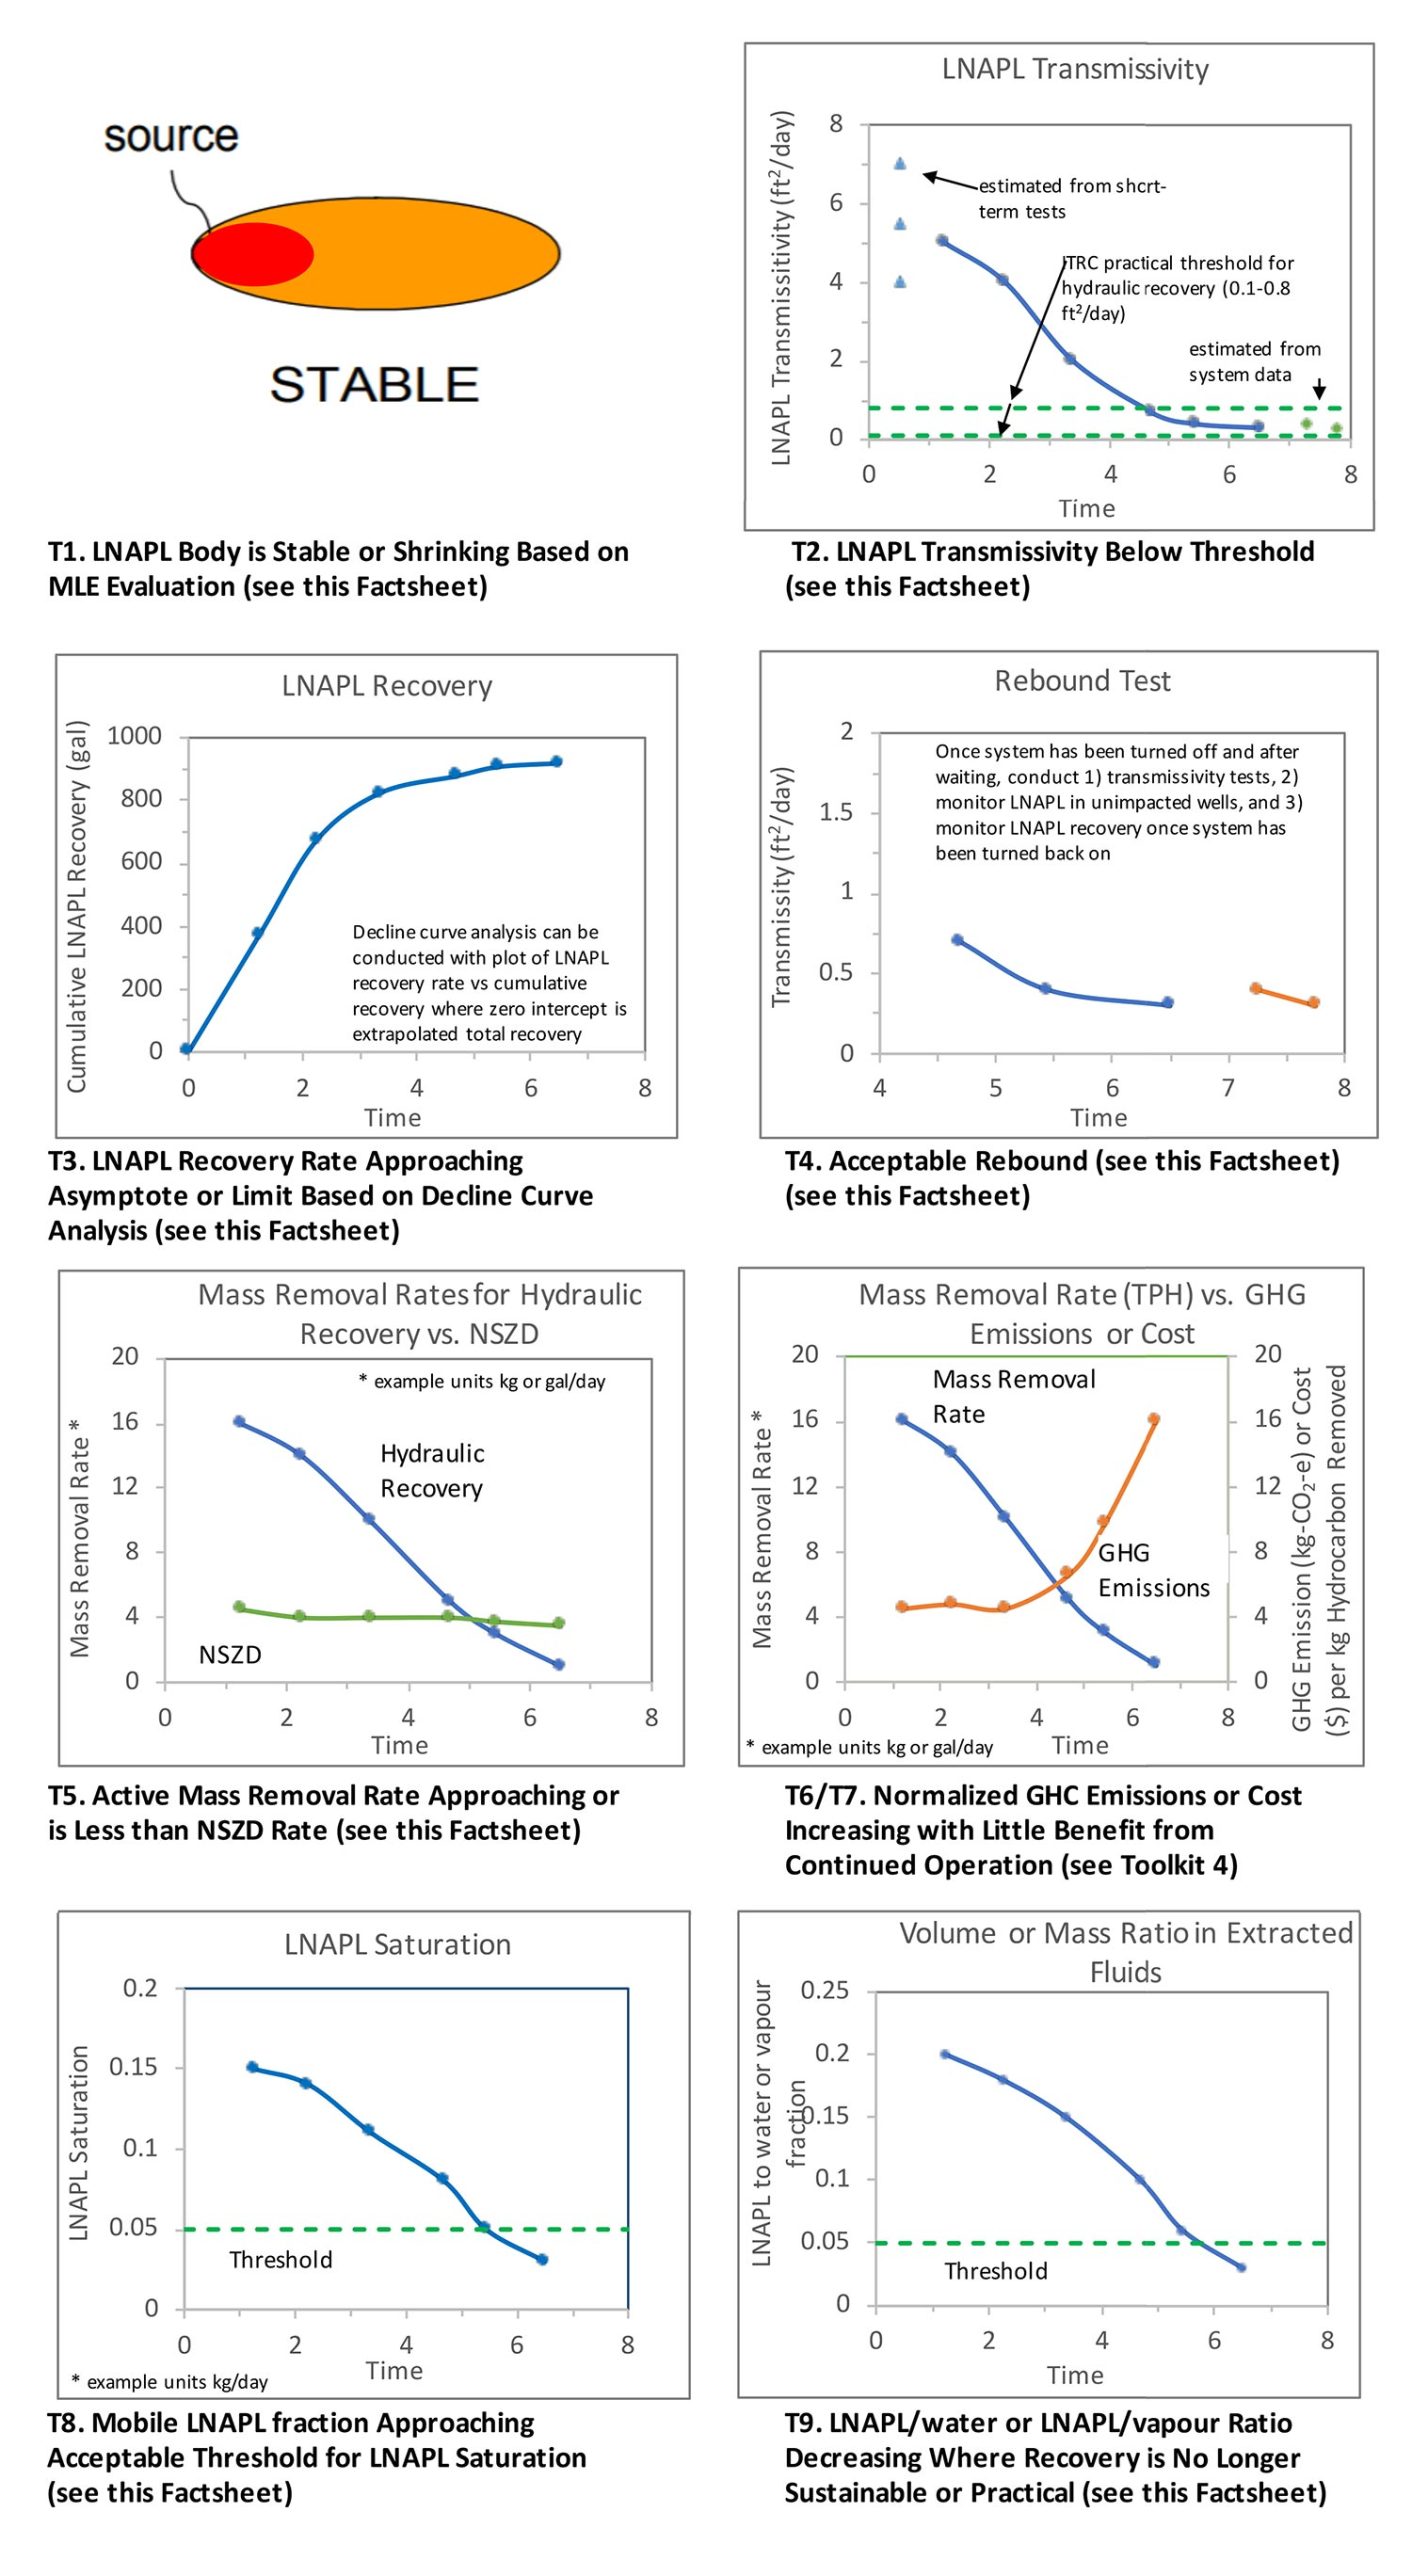
T1. Stable LNAPL body based on an MLE approach (see Appendix I for details).
T2. LNAPL transmissivity below a practical threshold for hydraulic recovery of 0.1 to 0.8 ft2/day (ITRC 2018) or alternative site-specific threshold. Time-series LNAPL transmissivity data can be plotted on a log-scale to estimate timelines for reaching thresholds.
T3. LNAPL recovery rates approaching asymptotic levels or a reasonable threshold percentage (e.g., 90-95%) of the estimated total recoverable LNAPL based on decline curve analysis (API 2001). The analysis can also be performed in terms of mobile LNAPL remaining approaching an acceptable threshold relative to residual saturation.
T4. Minimal or acceptable rebound (i.e., stability) in LNAPL transmissivity and lateral LNAPL extent while the system is turned off and the LNAPL recovery rate when the system is turned back on.
T5. Active LNAPL mass removal rates that are similar or less than “bulk” NSZD rates for TPH. The mass removal rates can be compared based on an area normalized rate in units of mass per time-area or for a representative LNAPL-impacted area or “site” in units of mass per time.
T6. Decreasing LNAPL mass removal rates and corresponding GHG emissions (or other quantifiable sustainability indicators) per mass of LNAPL removed that are increasing exponentially.
T7. Decreasing LNAPL mass removal rates and corresponding costs per mass of LNAPL removed that are increasing exponentially.
T8. Mobile LNAPL fraction is at or asymptotically approaching an acceptable threshold based on the measured LNAPL saturation. Modeling could be conducted to estimate a saturation threshold of concern.
T9. LNAPL/water ratio and/or LNAPL/vapor ratio is decreasing, potentially at an unsustainable rate meaning less and less LNAPL is recovered relative to other fluids. Because the ratios are not direct indicators of a potential concern, application of this threshold should be used with other thresholds.
Example Guidance on Thresholds for Termination of LNAPL Hydraulic Recovery System
Validation
NSZD assessments can also be considered in rebound testing (see Natural Attenuation Factsheet). While the system is operational, some methods for measuring NSZD may be affected by the system. Methods for assessing NSZD rates from systems with air-phase emissions are addressed in the SVE and Bioventing Factsheets.
The process for system shutdown (e.g., total system or phased) and parameters for validation tests including metrics to be tested, thresholds for system start-up and total duration of rebound monitoring should be agreed upfront with all key stakeholders before the system is turned off (i.e., as transition thresholds are becoming imminent).
Role of Natural Source Zone Depletion (NSZD)
NSZD is a key process and can be a consideration when establishing remedial goals for hydraulic LNAPL recovery. PHCs readily attenuate via a combination of natural processes (ITRC 2009a). As a result, NSZD can have a critical role in controlling the lateral expansion of mid-life LNAPL bodies when transmissivity approaches limiting thresholds and driving LNAPL head is reduced. Consequently, baseline NSZD rate measurements such as CO2 efflux and/or subsurface temperature to estimate PHC depletion rates should be considered (see the Compendium and Natural Attenuation Factsheets). This information should be factored into the establishment of remedial goals, performance metrics and transition thresholds to address LNAPL stability. Mahler et al. (2012) describe how natural loss rates of LNAPL can be compared to rates of LNAPL release and lateral migration.
| Metric | Locations/Frequency | |
|---|---|---|
| Performance Metrics | ||
| System | ||
| P1. Fluid recovery rates of LNAPL, water and gas depending on system | ||
| P2. PHC mass removal rates measured from LNAPL recovered and calculated from water and gas flow and PHC concentrations in water and gas | ||
| P3. Ratio of LNAPL to water recovery at extraction wells (unit volume of LNAPL per unit volume of water recovery) | ||
| P4. Ratio of LNAPL to vapor recovery at extraction wells (unit volume of LNAPL per unit volume of vapor) | ||
| P5. Pressures for vacuum-enhanced recovery at individual extraction wells, header and subsurface monitoring points | ||
| P6. Water level mounding at extraction wells when system is on | ||
| P7. Air treatment metrics such as consumption of thermal oxidizer assist gas for multi-phase extraction | ||
| Subsurface | ||
| P1. LNAPL presence/absence in wells | ||
| P2. LNAPL transmissivity estimated from tests in wells or system data | ||
| P3. Soil TPH concentrations and/or LNAPL saturations measured in soil cores (optional) | ||
| P4. Soil saturation measured in soil cores (optional) | ||
| P5. Laser induced fluorescence (LIF) profiles (optional) | ||
| Transition Thresholds | ||
| T1. Stable LNAPL body based on an MLE approach | ||
| T2. LNAPL transmissivity below a practical threshold for hydraulic recovery of 0.1 to 0.8 ft2/day or site-specific threshold | ||
| T3. LNAPL recovery rates approaching asymptotic levels or a reasonable threshold percentage of estimated total mobile LNAPL | ||
| T4. Minimal or acceptable rebound (i.e., stability) in LNAPL transmissivity, LNAPL extent, and LNAPL recovery rate | ||
| T5. Active LNAPL mass removal rates that are similar or less than “bulk” NSZD rates for TPH | ||
| T6. Decreasing LNAPL removal rates while normalized GHG emissions are increasing | ||
| T7. Decreasing LNAPL removal rates while normalized costs are increasing | ||
| T8. Mobile LNAPL fraction is at or asymptotically approaching an acceptable threshold | ||
| T9. LNAPL/water ratio and/or LNAPL/vapor ratio is decreasing and approaching an unsustainable limit | ||
Appendix I – LNAPL Basics and LNAPL Conceptual Site Model (LCSM)
An understanding of LNAPL fundamentals is essential for effective LNAPL management. There are many excellent guidance documents available that summarize the fundamentals including US EPA (2005), RTDF (2005), Golder (2006), Los Angeles (LA) LNAPL Working Group (2011), CL:AIRE (2014), API (2018), ITRC (2018), and Strasert et al. 2022. A short overview follows below.
LNAPL release sites are often characterized by an accumulation of buoyant LNAPL near the water table interface that has the potential to migrate laterally when present as a continuous or mobile phase. LNAPL that is discontinuous (i.e., present as disconnected globules) cannot migrate as a separate phase.
The potential for LNAPL migration is influenced by the LNAPL saturation and LNAPL transmissivity, which tend to be greatest near to the LNAPL release location and highest LNAPL head. Lateral LNAPL migration occurs as a multiphase fluid as described by Darcy’s Law and driven by the LNAPL gradient.
Toward the periphery of the LNAPL body, the LNAPL saturation will approach the saturation corresponding to the capillary pressure equal to that needed to penetrate the largest pore size, and the LNAPL at the body edge will be immobile. Weathering of LNAPL through biodegradation, volatilization and dissolution is an additional factor with an important role in controlling lateral expansion or translation of LNAPL bodies (Mahler et al. 2012).
Definitions of Migrating and Mobile LNAPL
Migrating LNAPL
- “LNAPL is considered migrating when it is observed to expand into previously unimpacted locations over time (i.e., in-well LNAPL appears in a monitoring well that had an initially clean borehole).
- LNAPL migration cannot occur unless LNAPL is present above residual…saturation.
- Reduction of LNAPL saturation to the residual range is not necessary to arrest LNAPL migration.”
Mobile LNAPL
- “LNAPL is considered mobile when it accumulates in a well… assuming the well is properly constructed and screened across the LNAPL smear zone.
- LNAPL is mobile when it is present at a saturation greater than residual.
- Mobile LNAPL is potentially hydraulically recoverable, but recoverability depends on various physical factors.
- LNAPL presence in a monitoring well does not necessarily mean that the LNAPL body is migrating.”
Often non-viscous mobile LNAPL (i.e., gasoline, diesel) will come to a stable footprint within a relatively short period of time (typically a few years) after the release has ceased and LNAPL head dissipates, while viscous LNAPL (e.g., No. 6 fuel oil) may take significantly longer to come to a stable endpoint (Oostrom et al. 2006).
LNAPL stability evaluations are described in detail in Golder (2006), LA LNAPL Working Group (2011), Cl:AIRE (2014), ITRC (2018), and Strasert et al. 2022. Basic information that may be utilized for stability evaluations include 1) date of LNAPL release termination; as releases age, there is greater likelihood that they will be stable; 2) release volume; all other factors being equal, larger releases will migrate further and for longer time periods than smaller releases; 3) LNAPL viscosity; because mobility is inversely proportional to viscosity, viscous LNAPL will take longer to reach a stable endpoint than less viscous LNAPL; 4) soil type; the soil permeability, grain size and porosity will influence the extent and rate of LNAPL migration.
The lines of evidence for a LNAPL stability evaluation may include:
- Continued LNAPL absence in appropriately located sentinel wells beyond the LNAPL body based on temporal data obtained at a frequency to capture seasonal fluctuations and over a sufficiently long period of time (minimum of 1-2 years)
- Stable or decreasing LNAPL thicknesses in wells screened across water table for unconfined LNAPL; groundwater elevation fluctuations should be considered when interpreting data and tools such as diagnostic gauge plots should be used (ANSR 2011)
- Stable or decreasing predicted specific LNAPL volumes estimated for LNAPL thicknesses and vertical equilibrium model (API 2007)
- Dissolved-plume concentrations downgradient of the LNAPL body that are stable or decreasing from which it is inferred that the LNAPL body is also stable or shrinking (an expanding dissolved plume does not necessarily indicate an expanding LNAPL body)
- LNAPL transmissivity below a threshold, indicating that hydraulic recovery is no longer practical (see ASTM 2013, ITRC 2018); transmissivity is primarily a metric for recovery but also an approximate indicator of mobility; note time-series transmissivity data plotted of log Tn versus time scale can be used to estimate timelines for achieving a transmissivity threshold.
- LNAPL recovery data approaching asymptotic limits or approaching limits of recovery based on decline curve analysis (API 2001)
- LNAPL seepage velocities that are less than a de-minimus value (Golder 2006; ITRC 2018)
- Measured LNAPL saturation in core samples that are approaching or are below residual saturation
- Measured LNAPL thicknesses in wells that are less than the theoretical thicknesses necessary for migration into soil pores unimpacted by LNAPL based on capillary entry pressure concepts
- NSZD rates similar to or greater than the LNAPL volumetric flow rate estimated from transmissivity measurements
There are critical basic data that should be collected regardless of site size and complexity. These data include the hydrogeology and stratigraphic conditions, water level and LNAPL thickness data, three-dimensional spatial delineation of the LNAPL body, characterisation of the physicochemical properties of the LNAPL, an assessment of LNAPL transmissivity, and baseline NSZD assessment (can be qualitative or quantitative depending on project requirements). For projects that require additional data (often as part of a MLE approach), speciality core analysis can provide information on soil or rock porosity, LNAPL saturation, relative permeability– capillary pressure relationships, moisture retention and residual saturation ratios.
There is no single accepted way of developing and communicating an LCSM. The use of cross-sections to show key hydrogeological and stratigraphic features and LNAPL distribution is often useful. Preferential pathways if present should be shown. The temporal changes in air-LNAPL and LNAPL-water interfaces, water level corrected for LNAPL density and LNAPL thickness data should be shown on hydrostratigraphs. Another essential tool are diagnostic gauge plots where fluid interfaces, levels and LNAPL thicknesses are plotted (ANSR 2011). From these data, the LNAPL behaviour with respect unconfined, confined or perched conditions should be assessed.
While LNAPL thickness can be a useful metric for developing the LNAPL CSM, it is poorly correlated to LNAPL recovery and mobility. Consequently, the LNAPL thickness should be used with caution in management of sites impacted by LNAPL.
Appendix II – LNAPL Hydraulic Recovery Technology Evaluation and Options
Hydraulic Recovery Technology Evaluation
While LNAPL transmissivity is a key parameter for evaluation of LNAPL recovery, other important parameters include the LNAPL saturation, LNAPL viscosity and soil properties (grain size, porosity, permeability). These parameters will control the volume of mobile LNAPL in the subsurface, and the rate and longevity of LNAPL recovery. These factors have implications for selection and design of the hydraulic recovery technology.
The estimation of LNAPL saturation through collection of soil cores and estimation from TPH data or direct measurement is often warranted. Data on LNAPL thickness in wells, while not a reliable predictor for recovery, may be used to predict saturation from the vertical equilibrium model. Modeling can provide insight of the specific volume of mobile LNAPL for different soil types, which can vary significantly between coarse- and fine-grained soil. From saturation data, it is possible to estimate the mobile and potentially recoverable LNAPL (recognizing that not all the mobile LNAPL is recoverable). This approach can help in the identification of an appropriate recovery technology and avoid costly decisions to install systems when not warranted or effective.
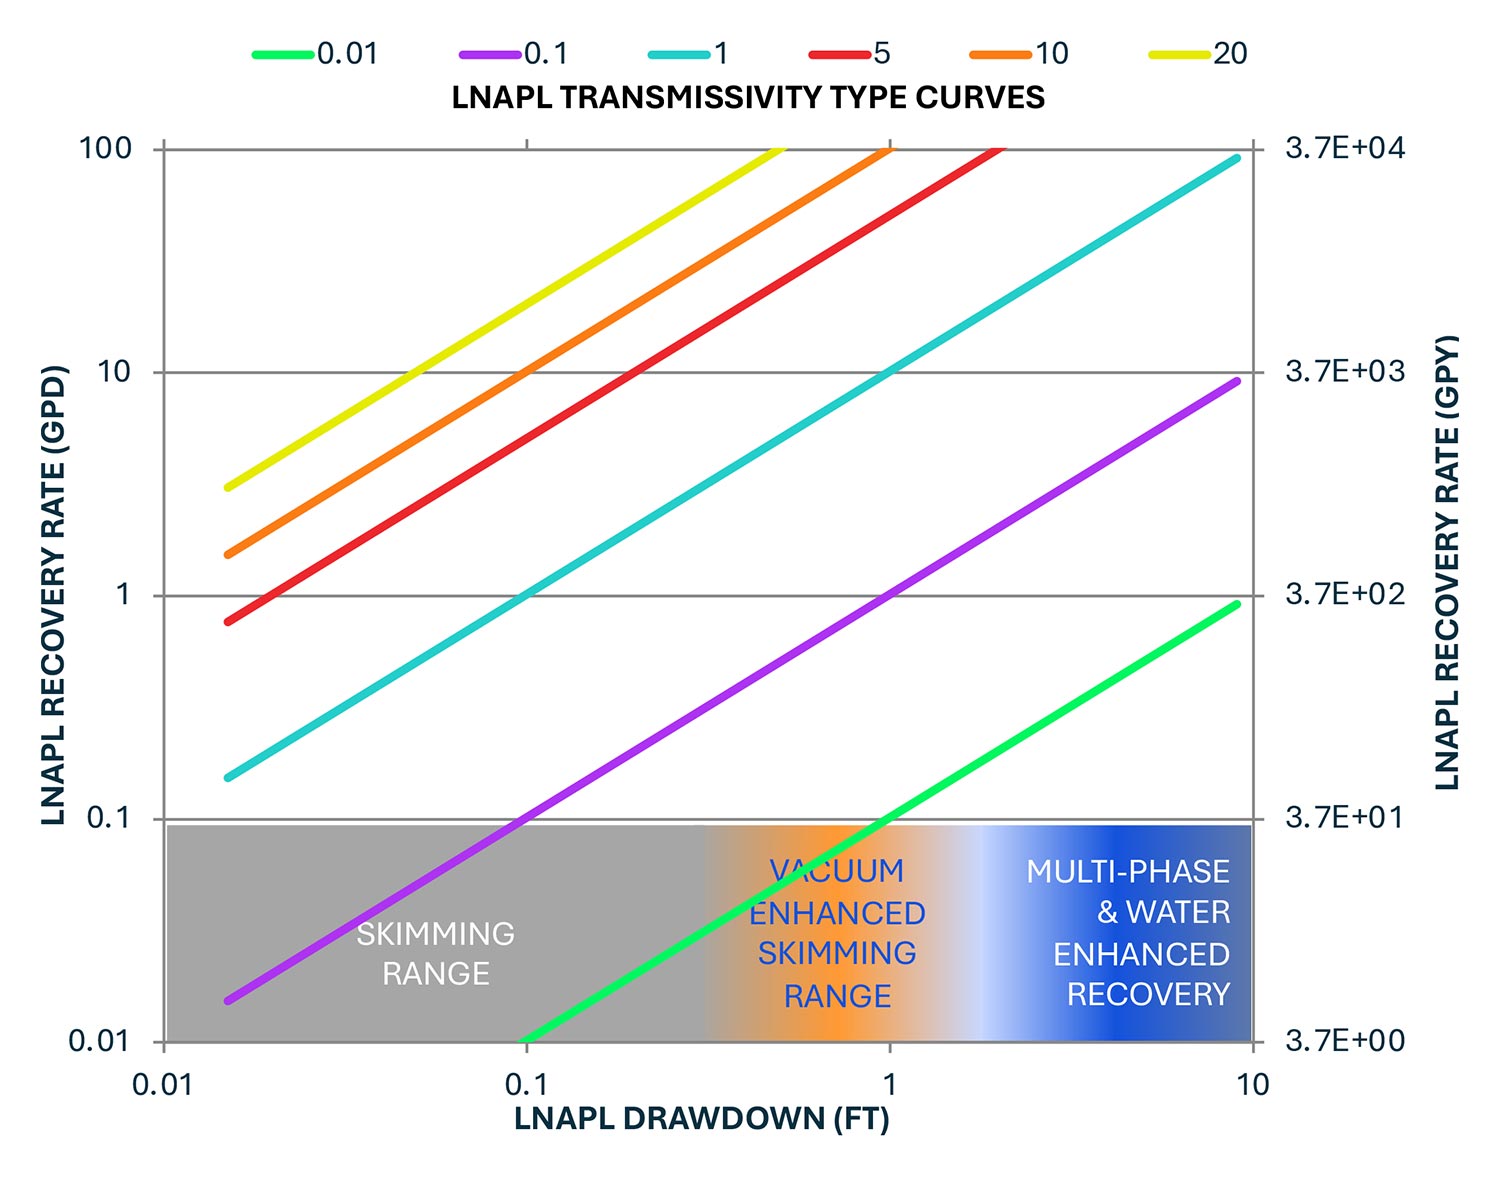
LNAPL recovery for skimming can be estimated from the transmissivity using the following equation:

It is also possible to estimate the change in saturation from the LNAPL recovery rate. This is an approximate change because the LNAPL recovery rate will decrease over time. The change in saturation is estimated using Equation 2.

One can also estimate the reduction in soil concentrations using:

Historically, methods based on LNAPL thicknesses in wells combined with LNAPL properties (e.g., viscosity) and soil permeability have been used to develop thresholds and charts for when hydraulic recovery is feasible (e.g., MADEP 2016). These methods are not recommended as a primary line of evidence for evaluation of hydraulic recovery.
Hydraulic Recovery Technologies
The common hydraulic recovery technologies are described below. Additional information is provided in ITRC (2018) – Table A.
Skimming: LNAPL is removed under natural gradients at the air/LNAPL interface air using a pump or similar continuous mechanical device (e.g., belt skimmer). There may be incidental, small volume water recovery. The radius of influence of skimming systems can be relatively limited. Skimming is typically more effective in permeable soils and can be useful as a relatively low cost, long-term technique for LNAPL recovery. According to CRC Care (2018a), the hydraulic conductivity should be greater than 10-4 cm/sec (0.3 ft/day) to ensure a sufficient influx of LNAPL to the skimmer. CRC Care (2018a) further states LNAPL skimming is generally applicable to all LNAPL types, although lower viscosity LNAPL (0.5-1.5 centipoise) is much more recoverable than higher viscosity LNAPL (>6 centipoise).
Vacuum Enhanced Skimming: LNAPL and vapor are the fluids removed. LNAPL drawdown via skimming and vacuum induce an LNAPL gradient toward the recovery point to enhance recovery. The addition of vacuum creates a zone of negative pressure around the well causing LNAPL to flow horizontally across the pressure-induced gradient. The induced vacuum can extract LNAPL-derived vapor from the unsaturated zone and capillary fringe. This technology is also referred to as bioslurping or vacuum enhanced fluid recovery (VEFR).
Total Liquid Extraction: LNAPL and water are the fluids removed. Drawdown of LNAPL and groundwater induce an LNAPL gradient toward the recovery point. Groundwater drawdown may expose submerged LNAPL thereby increasing LNAPL mobility and recovery rate. However, caution should be applied to not create excessive drawdown and smearing of LNAPL thereby causing reduced LNAPL mobility. Groundwater extraction may also provide hydraulic containment of potentially migrating LNAPL. Total liquid extraction may be implemented by removing both groundwater and LNAPL from a well using a single pump to collect both liquids, or using a dual (two) pump system to collect each liquid separately. Typically, electric submersible or pneumatic pumps are used to recover fluids. A disadvantage of a single pump system is possible emulsification of LNAPL that requires LNAPL/water separation as part of water treatment. This technology when two pumps are used may also be referred to as dual pump liquid extraction (DPLE) (ITRC 2018).
Multi-Phase Extraction (MPE): LNAPL, water, and vapor are the fluids removed. The drawdown of LNAPL and groundwater, and the imposed vacuum induce an LNAPL gradient toward the recovery point. Groundwater drawdown may expose submerged LNAPL within the zone of drawdown thereby increasing the LNAPL recovery rate. Groundwater extraction may also provide hydraulic containment of potentially migrating LNAPL. Multiple pumping configurations are available. Vacuum-enhancement combined with two dedicated pumps is an option that may be applicable where LNAPL recovery is sufficient to warrant a dedicated pump and where minimization of emulsification is desired. The option to cycle the pump off and on to optimize the removal of accumulated LNAPL in wells should also be considered. Single-pump configurations include a downhole pneumatic pump that removes groundwater and LNAPL, or a high vacuum stinger tube to remove groundwater, LNAPL, and vapour. MPE often will emulsify LNAPL and require LNAPL/water separation. MPE is also often used as a phase-change technology to meet a composition concern where LNAPL is exposed to enhanced volatilization and enhanced aerobic biodegradation with hydraulic LNAPL recovery as a secondary remediation objective. This technology is also referred to as dual-phase extraction (DPE) or two-phase extraction (TPE).
Recovery trenches: LNAPL is intercepted and recovered using a trench that is oriented perpendicular to the direction of LNAPL migration and is backfilled with a high permeability material. Trenches may be constructed with a low permeability synthetic membrane on the downgradient side that intersects the water table and acts as a barrier to horizontal LNAPL migration, focusing collection of the LNAPL and allowing groundwater to pass below the barrier. LNAPL may be recovered through sumps with skimming pumps or vacuum-enhanced skimming pumps or belt skimmers. Trenches may be an appropriate technology when the water table is shallow (< 3 m from the surface) and in heterogenous soils.
Appendix III – LNAPL Transmissivity
LNAPL transmissivity is 1) an improved metric over in-well LNAPL thickness to determine when hydraulic recovery may be a feasible mass reduction technology; and 2) a key transition threshold for when recovery has reached its practicable limit, or a concern has been abated. LNAPL transmissivity measurements are relevant to LNAPL saturation remedial objectives, such as controlling LNAPL migration or recovering LNAPL to the extent practicable.
LNAPL transmissivity is a representative metric for LNAPL recovery by hydraulic methods including skimming, pumping or vacuum extraction. ITRC (2018) indicates that “an LNAPL transmissivity between the range of 0.1 to 0.8 ft2/day may be used as a decision point for remedial system operation or technology transitions.” Kirkman (2013) states this range represents the LNAPL transmissivity that occurred at multiple sites that were closed with data indicating: 1) LNAPL recovery was asymptotic and small compared to residual LNAPL in place; 2) remaining LNAPL was stable and not migrating; and 3) on-going remediation would not significantly improve site conditions. Site data supporting this recommendation is summarized in ITRC (2018). Some regulatory jurisdictions use the approximate mid-point (0.5 ft2/day) of the range as a decision threshold (e.g., Michigan DEQ 2014). MADEP (2016) in contrast have adopted the maximum value (0.8 ft2/day). Transmissivity should be used in conjunction with other lines of evidence for decision-making.
LNAPL transmissivity can be defined as the discharge of LNAPL through a unit width of aquifer for a unit gradient and is analogous to groundwater aquifer transmissivity. LNAPL transmissivity can be estimated with LNAPL baildown or other well testing techniques where the well screen intersects the interval of mobile LNAPL (ASTM 2013; ITRC 2018), as follows:
- short-term LNAPL baildown tests (drawdown followed by recovery);
- short-term LNAPL skimming (continuous drawdown);
- long-term LNAPL recovery methods utilizing recovery data; and
- tracer test method to estimate LNAPL flux through a well.
Modeling approaches can also be used for estimation of LNAPL transmissivity from in-well LNAPL thickness data (API LDRM). A model refinement that incorporates water level fluctuations and predicts free, entrapped and residual LNAPL saturation and LNAPL transmissivity is described in Lenhard et al. (2018).
Appendix IV - Optimization of hydraulic recovery systems
- Adjusting system operation to increase pumping rates in zones with highest mass removal rates.
- Reduction of system pumping rate and/or operational time to balance LNAPL discharge to wells to achieve lower operational costs.
- Optimal groundwater drawdown to maximize LNAPL recovery while not creating excessive drawdown and smearing of LNAPL to the point where LNAPL is no longer a continuous phase.
- Use of direct push tools such as laser induced fluorescence (LIF) to identify zones of higher LNAPL saturation based on correlation to LIF response or hydraulic profiling tool (HPT) as an indicator of soil permeability thus enabling more optimal placement of wells.
- Enhanced methods for LNAPL recovery include water flooding, surfactant-enhanced subsurface remediation (SESR) and cosolvent flushing.
- Multi-dimensional multiphase simulations to optimize operation of multiple well systems for LNAPL recovery (Qin et al. 2009; Lari et al. 2018; Bortoni et al. 2019).