Appendix I – SVE Technology Description
ESTCP (2002) Air Sparging Design Paradigm
- Site characterization and development of site conceptual model
- Preliminary feasibility assessment
- Pilot testing
- Design
- Monitoring
The pilot testing is divided into two approaches, 1) standard design approach and 2) site-specific design approach. For each of these two approaches there are default designs and recommended monitoring. The flow chart for air sparging design including pilot testing is shown in Figure B-1.
The standard design approach recommends the following data collection: injection pressure versus flow rate test, transient pressure response test, dissolved oxygen measurements, helium tracer test and soil gas sampling. Based on this data set, injection wells based on 15 ft centers and 20 ft3/min injection rate are recommended. The site-specific design approach recommends the standard methods plus sulphur hexafluoride tracer test to assess air distribution more accurately.
Overview of Technology
The phase change and mass removal typically decrease during the treatment life cycle. During early stages of remediation, the primary mass removal is from air pathways of low resistance (higher permeability soils), where chemicals in adsorbed phase or non-aqueous phase liquids (NAPL) partition into the moving air. Contaminants in lower permeability soils will not be removed by advection because soil vapors will preferentially flow through higher permeability soils. When the mass in higher permeability soils becomes mostly depleted, the rate of mass removal may approach a low value or cumulative mass recovery may approach an asymptotic value. This is because contaminants in lower permeability silts and clays and within the capillary fringe, if present, must desorb and diffuse into an advective flow path before they can be removed by the SVE system. If the rate of diffusion is slow, the time duration for removing VOCs may be significantly extended (US EPA 1991). US EPA (2018) describes a two-compartment model (coarse- and fine-grained) for prediction of concentrations and clean-up times when there are mass transfer limitations resulting from slow diffusive transport in fine-grained soil layers.
The addition of air through SVE may result in enhanced aerobic biodegradation and consequently SVE is closely related to bioventing (refer to Bioventing Factsheet). Because there is often contamination at or below the water table, remediation through air sparging will often be an additional component to the SVE system.
Exit Strategy Toolkit
Compendium
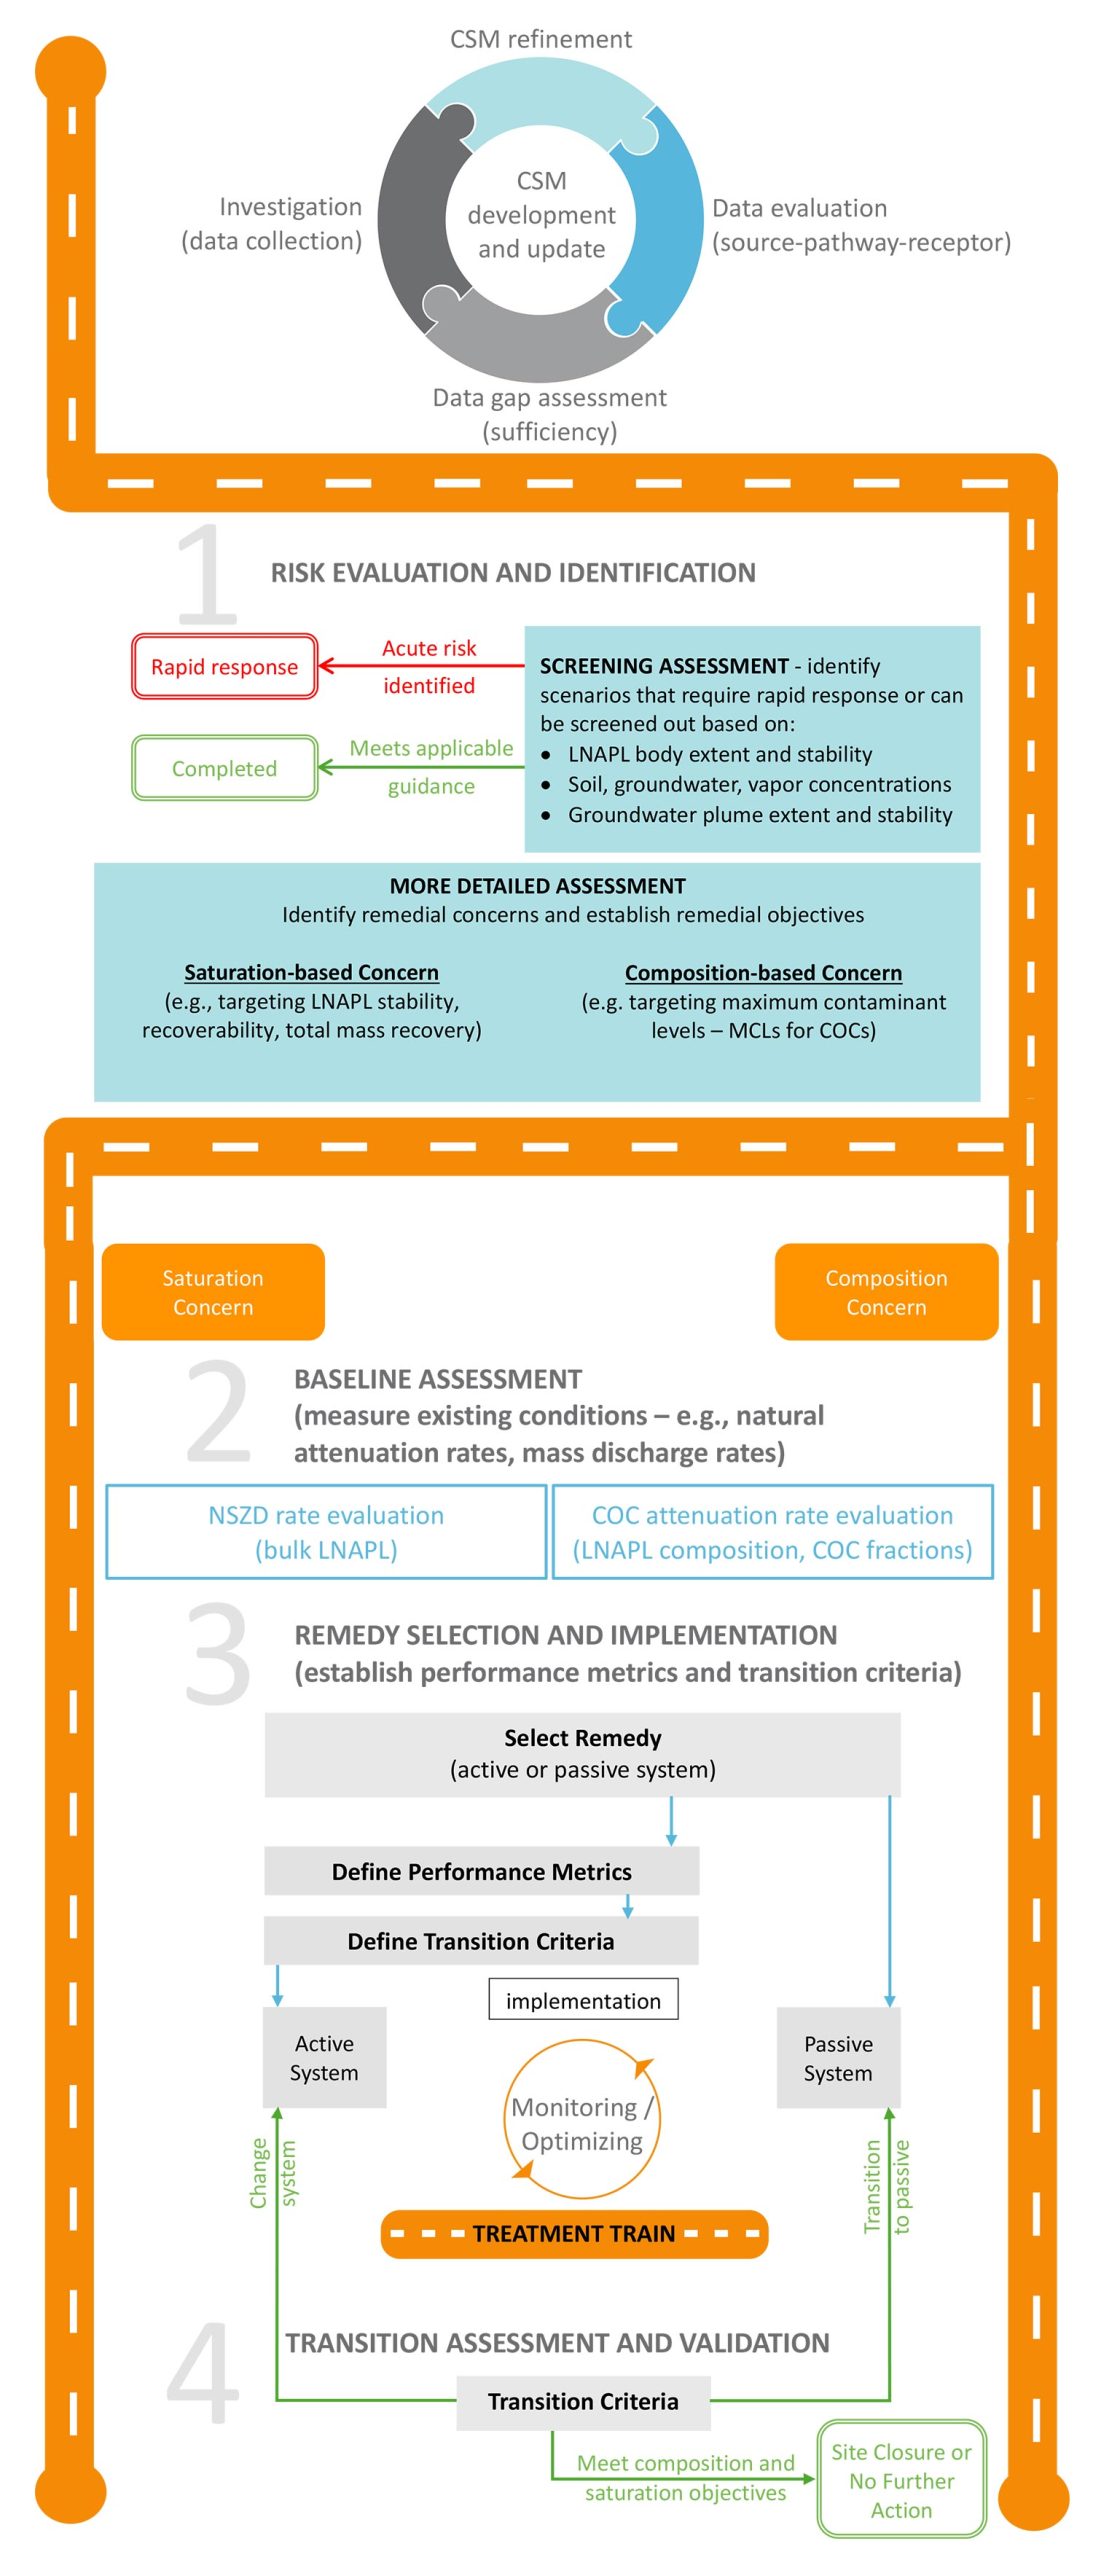
A Roadmap to the Application of the Exit Strategy Toolkit
Stage 1: Risk Evaluation and Identification
Stage 2: Baseline Assessment
Stage 3: Remedy Selection and Implementation
Stage 4: Transition Assessment and Validation.
The development of a conceptual site model (CSM) is an essential and dynamic component of the LNAPL site management process. A CSM sufficient to identify and evaluate risk-drivers must be completed prior to Stage 1. The CSM is updated and refined throughout the site investigation and remediation process, with a goal of identifying and managing current and future risks to human health and the environment. The CSM generally involves characterizing sources, exposure pathways and receptors, and assessing concentration trends for COCs in soil, groundwater, soil gas, and LNAPL. The level of data collection and analysis typically corresponds with the level of site risk and complexity. Guidance on developing good CSMs is provided in ASTM E2531 (2020), CRC CARE (2015), and ITRC (2018).
The overarching objective of the Exit Strategy Toolkit (Compendium + Factsheets) is to provide practical measures for sustainable remediation of sites. It is specifically intended to optimize resource use, while managing risk to human health and the environment. Sustainable remediation includes limiting energy use, cost, and GHG emissions without compromising the risk management of the site by assessing and implementing natural (or enhanced) remedies over active (or engineered) remedies. This includes timely transitions from active to passive remediation.
Stage 1 - Risk Evaluation & Identification
Establish remedial concerns and goals
Remedial concerns and remedial goals should be agreed upon and aligned upfront with all key stakeholders prior to the selection and implementation of any active remediation (ITRC 2018; CRC CARE 2018, 2020; and Golder 2021). ITRC defines four types of remedial concerns:
- pose a risk to health or safety (composition-based),
- result in additional LNAPL migration (saturation-based),
- address an LNAPL-specific regulatory requirement (regulatory-based), or
- create some other physical or aesthetic impact or other specific regulatory or stakeholder requirements.
Mass-based Estimates
- mass flux – mass per unit area per time
- mass discharge – mass per time crossing plane of interest, and
- mass loading – mass per time at intersection of plume and receptor.
Example tools include GSI Mass Flux Toolkit, which enables estimation of dissolved-phase mass discharge based on transect of groundwater concentration data, and the BioVapor model, which includes estimation of vapor-phase mass loading into a building
| Remedial Concerns | Primary Mechanism | Remedial Goal | Typical Remedial Technologies |
|---|---|---|---|
| Saturation: Presence of migrating or mobile LNAPL | Mass removal or recovery (bulk removal/recovery of free-phase mass) | Abate LNAPL migration or reduce LNAPL mobility | Hydraulic Recovery Multi-Phase Extraction |
| Composition: Concentrations or mass discharge/loading exceeding health-based criteria (human or ecological) | Phase Change and Mass Reduction (removal of constituents based on differing physico-chemical properties and partitioning between source, soil, vapor, and groundwater media) | Reduce concentrations or mass discharge/loading | Soil Vapor Extraction Bioventing Air (and Bio) Sparging Monitored Natural Attenuation (including NSZD) Multi-Phase Extraction |
Stage 2: Baseline Assessment
- benchmark rates of hydrocarbon mass loss (e.g., bulk LNAPL depletion or COC attenuation);
- estimate minimum timelines for natural and enhanced depletion;1
- inform remedy selection in Stage 3 (active or passive); and
- support termination of active remediation in Stage 4
Baseline Assessment: Natural Attenuation Rate Measurements
Stage 3: Remedy Selection & Implementation
The selection of an active remediation system should consider amongst other factors:
- sustainable practices;
- the established remedial timeframe; and
- baseline natural attenuation rates determined in Stage 2.
Key guidance and resources for remedy selection include the ITRC LNAPL Guidance (ITRC 2018), the Remediation Technologies Screening Matrix (FRTR, 2020), and the Golder Remediation Toolkits (2016, 2021). The Tookits also include various sustainability indicators and tools for assessing carbon footprints. The EnviroWiki page on Sustainable Remediation provides additional resources (EnviroWiki) specific to site remediation, while Envision® is another resource for sustainable design of infrastructure in general.
Define Performance Metrics & Transition Thresholds
Performance Metrics
Remedy Optimization
The monitoring requirements should be agreed upfront with all relevant stakeholders. At some sites with large monitoring networks and long-term monitoring, it may be possible to optimize data collection (i.e., location and frequency of sampling) using certain tools and guidance that include statistical analyses, such as, Monitoring and Remediation Optimization System (MAROS), GWSdat, US EPA, FRTR, and ITRC (2014). Remote sensing equipment and telemetry that provide continuous monitoring can also help reduce mobilizations to and from sites, and thereby reduce costs and exposure hours.
Transition Thresholds
Performance Metrics
- LNAPL presence/absence in wells (S)
- LNAPL transmissivity (S)
- LNAPL saturation (mobile fraction remaining) (S)
- LNAPL velocity (S)
- NSZD (bulk TPH or COC) rate (S & C)
- NA rate (C)
- Concentration and/or mass discharge (C)
- Concentration and/or mass discharge attenuation rate (C)
- Geochemical parameters for assessing natural attenuation, electron acceptors (S & C)
- LNAPL presence/absence in wells (S)
- LNAPL recovery rate vs. time, cost or greenhouse gas (GHG) emissions (S)
- LNAPL decline curve analysis
- LNAPL/vapor ratio or LNAPL/water ratio (S)
- TPH/COC mass recovery vs. time, cost or GHG emissions (C)
- TPH/COC concentration attenuation (C)
- COC ratios in water or vapor (C)
Transition Thresholds
- Recovery of 95% of LNAPL based on decline curve analysis (S)
- LNAPL transmissivity below ITRC (2018) threshold of 0.1 to 0.8 ft2/day (S)
- Concentrations or mass discharge at or approaching criteria within accepted statistical certainty (C)
- Active mass recovery rates similar to or less than NSZD (bulk) rates (S)
- Active attenuation rates similar to or less than natural attenuation rates (C)
- No or limited rebound in concentrations or mass following temporary active system shutdown
- Mass removal or concentration attenuation rates by active recovery approaching asymptotic levels while ratio of GHG emissions per unit reduction in mass or concentration is rapidly increasing (S & C)
- Mass removal or concentration attenuation rates by active recovery approaching asymptotic levels while ratio of costs per unit reduction in mass or concentration is rapidly increasing (S & C).
| Metric | Methods | Relative Cost | References/Tools |
|---|---|---|---|
| LNAPL transmissivity | Bail-down or skimming test LNAPL-water ratio Data from LNAPL recovery system (analysis of LNAPL/water ratio) | Low to Moderate | • ITRC LNAPL Guidance (ITRC, 2018) • Standard Guide - Estimation of LNAPL Transmissivity (ASTM, 2021) • API LNAPL Transmissivity Workbook (API, 2016) and videos • API Baildown Testing Video • LNAPL Toolbox (Strasert et al 2021) |
| LNAPL footprint (presence/absence in monitoring wells) | Time-series measurements in perimeter monitoring wells | Low | • ITRC LNAPL Guidance (ITRC, 2018) |
| LNAPL thickness in wells | Time-series measurements in LNAPL body taking into account spatiotemporal variability (e.g. water-table fluctuations) | Low | • ITRC LNAPL Guidance (ITRC, 2018) |
| Mobile LNAPL | Compare actual to residual LNAPL saturation; estimated from vertical equilibrium (VEQ) model or lab measurements | Moderate to High | • ITRC LNAPL Guidance (ITRC, 2018) • LNAPL Toolbox (Strasert et al 2021) • API Interactive LNAPL Guide (2006) • API LNAPL Distribution and Recovery Model (LDRM) (API 2007) |
| Migrating LNPAL | Tools used to assess the stability of a mobile LNAPL: LNAPL footprint, thickness, transmissivity and mobility (taking seasonal changes into account) | Low to Moderate | • API Interactive LNAPL Guide (2006) • ASTM Moving Sites to Closure |
| LNAPL saturation profile | Estimate from saturation in soil samples or estimate from TPH and/or Estimated from vertical equilibrium (VEQ) model during or after system operation | Moderate to High | • ITRC LNAPL Guidance (ITRC, 2018) • LNAPL Toolbox (Strasert et al 2021) |
| LNAPL velocity | Estimate from transmissivity or vertical equilibrium (VEQ) model | Moderate to High | • API Interactive LNAPL Guide (2006) • API LNAPL Distribution and Recovery Model (LDRM) (API 2007) |
| NSZD rate (bulk) | Unsaturated zone biodegradation rate (e.g., CO2 efflux, soil gas gradient, temperature methods) | Low to High | • Natural Attenuation Factsheet (and references therein) |
| LNAPL movement in sediment (aquatic environment)2 | Metrics for advective NAPL movement: measurements to assess pore scale mobility; and/or evaluate migration | Low to High | • ASTM Standard Guide for NAPL Mobility and Migration in Sediment (ASTM, 2021) • Metrics for Evaluating Advective NAPL Movement in Sediments (Reyenga 2021) |
| Subsurface rebound test | Turn system off temporarily and monitor response (e.g., LNAPL body stability, transmissivity) | Moderate to High | • See technology specific factsheets • ITRC LNAPL Guidance (ITRC, 2018) • A Practitioner’s Guide for LNAPL Management (CRC Care 2015) |
| Geochemical parameters (e.g., O2, CH4) indicative of natural attenuation | Soil gas and/or groundwater sampling and analysis | Low to Moderate | • Remediation Toolkits 1 & 2 (Golder, 2016) • Remediation Toolkits 3 & 4 (Golder, 2021) • ITRC LNAPL Guidance (ITRC, 2018) |
| LNAPL recovery | Cumulative LNAPL recovery LNAPL recovery rate LNAPL recovery analysis (e.g., asymptotic trends, decline curve) | Low | • LNAPL Distribution and Recovery Model (LRDM) (API, 2007) • MADEP LNAPL Guidance (2016) • Methods for Determining Inputs to Environmental Petroleum Hydrocarbon Mobility and Recovery Models (API, 2001) • ITRC LNAPL Guidance (ITRC, 2018) • LNAPL Toolbox (Strasert et al., 2021) |
| LNAPL: water ratio | Measurement of collected fluid | Low | • ITRC LNAPL Guidance (ITRC, 2018) • Standard Guide - Estimation of LNAPL Transmissivity (ASTM 2021) |
| System rebound test | Turn system off temporarily and then on and then monitor applicable parameters (e.g., LNAPL recovery) | Low | • See technology specific factsheets • ITRC LNAPL Guidance (ITRC, 2018) • A Practitioner’s Guide for LNAPL Management (CRC Care 2015) |
| Physical parameters | Pressure, temperature, water levels, etc. to optimize system performance | Low | • See technology specific factsheets |
| Cost | Cost per unit reduction or change (e.g., LNAPL recovery volume (gallons) per unit cost) | Low | • See technology specific factsheets • FRTR Remediation Technology Assessment Reports |
| GHG emissions | Greenhouse Gas (GHG) emissions (or other indicator) per unit reduction or change (e.g., LNAPL recovery volume (gallons) per kg CO2-e) | Moderate | • Remediation Toolkits 3 & 4 (Golder, 2021) • Sitewise™ • Methodology for Understanding and Reducing a Project’s Environmental Footprint (US EPA, 2012) |
| Metric | Methods | Relative Cost | References/Tools |
|---|---|---|---|
| Groundwater concentration | Monitoring well measurements Multiple Lines of Evidence (MLE) assessment of stability | Low | • Technical Guide for Demonstrating MNA (CRC CARE 2010) • Remediation Toolkits 3 & 4 (Golder 2021) • API GWSDAT (Jones et al 2021) • Ricker Method (Ricker 2008) |
| Groundwater concentration attenuation rate | Monitoring well measurements Trend analysis Environmental Molecular Diagnostic tools, such as, molecular biological tools (MBT), stable isotope probing (SIP), compound-specific stable isotope analysis (CSIA) | Low to Moderate | • ASTM E3354 (2022) • Remediation Toolkits 1 & 2 (Golder 2016) • Monitoring and Remediation Optimization System (MAROS), US EPA • GSI Mann-Kendall Toolkit • API GWSDAT (Jones et al 2021) |
| Soil vapor concentration | Monitoring well or soil-gas measurements Rebound tests | Low to Moderate | • Vertical distance screening (Lahvis et al 2013) • BioVapor Model (API, 2012) • ITRC PVI Guidance • US EPA PVI Technical Guide |
| Groundwater mass flux, discharge or loading rates | Monitoring well measurements along transect Integral pump test Passive flux meter Tracers | Moderate to High | • Use and Measurement of Mass Flux & Mass Discharge (ITRC, 2010) • GSI Mass Flux Toolkit (Farhat et al 2011) |
| Soil vapor flux from or to groundwater | Monitoring well or soil-gas measurements Sub-slab depressurization exhaust Building measurements | Moderate to High | • BioVapor Model (API, 2012) |
| NSZD rate (COC) | Gradient method (soil vapor and/or groundwater), compositional change method (LNAPL) | Low to Moderate | • Natural Attenuation Factsheet (and references therein) |
| LNAPL composition | LNAPL samples and analysis | Moderate to High | • LNAPL Compositional Change Model (DeVaull et al 2020) |
| Subsurface rebound test | Turn system off temporarily and monitor response (e.g., GW concentration, soil vapor concentration, mass discharge) | Moderate to High | • See technology specific factsheets • Soil Vapor Extraction System Optimization, Transition, and Closure Guidance (Truex et al 2013) |
| Concentrations in extracted or discharged fluids | Measure concentrations in fluids (gas, water, liquid-phase hydrocarbon) by field screening including potential isotopic (e.g., 14C) for assessing biodegradation | Moderate to High | • See technology specific factsheets |
| Extraction flow rates | Measure rates of fluids (gas, water, liquid-phase hydrocarbon) | Low | • See technology specific factsheets |
| Hydrocarbon mass removal | Cumulative mass recovery Hydrocarbon recovery rate | Low to Moderate | • See technology specific factsheets |
| Concentration ratio | Measured COC ratios in extracted fluids | Low to Moderate | • See technology specific factsheets |
| System rebound test | Turn system off temporarily and then on and then monitor applicable parameters (e.g., concentrations, mass removal rates) | Moderate | • See technology specific factsheets |
| Physical parameters | Pressure, temperature, water levels, etc. to optimize system performance | Low to Moderate | • See technology specific factsheets |
| Cost | Cost per unit reduction or change (e.g., hydrocarbon mass recovered per unit cost) | Low to Moderate | • See technology specific factsheets • FRTR Remediation Technology Assessment Reports |
| GHG emissions | Greenhouse Gas (GHG) emissions (or other indicator) per unit reduction or change (e.g., hydrocarbon mass recovered or concentration reduction per kg-CO2-e) | Moderate to High | • Remediation Toolkits 3 & 4 (Golder, 2021) • Sitewise™ • Methodology for Understanding and Reducing a Project's Environmental Footprint (US EPA 2012) |
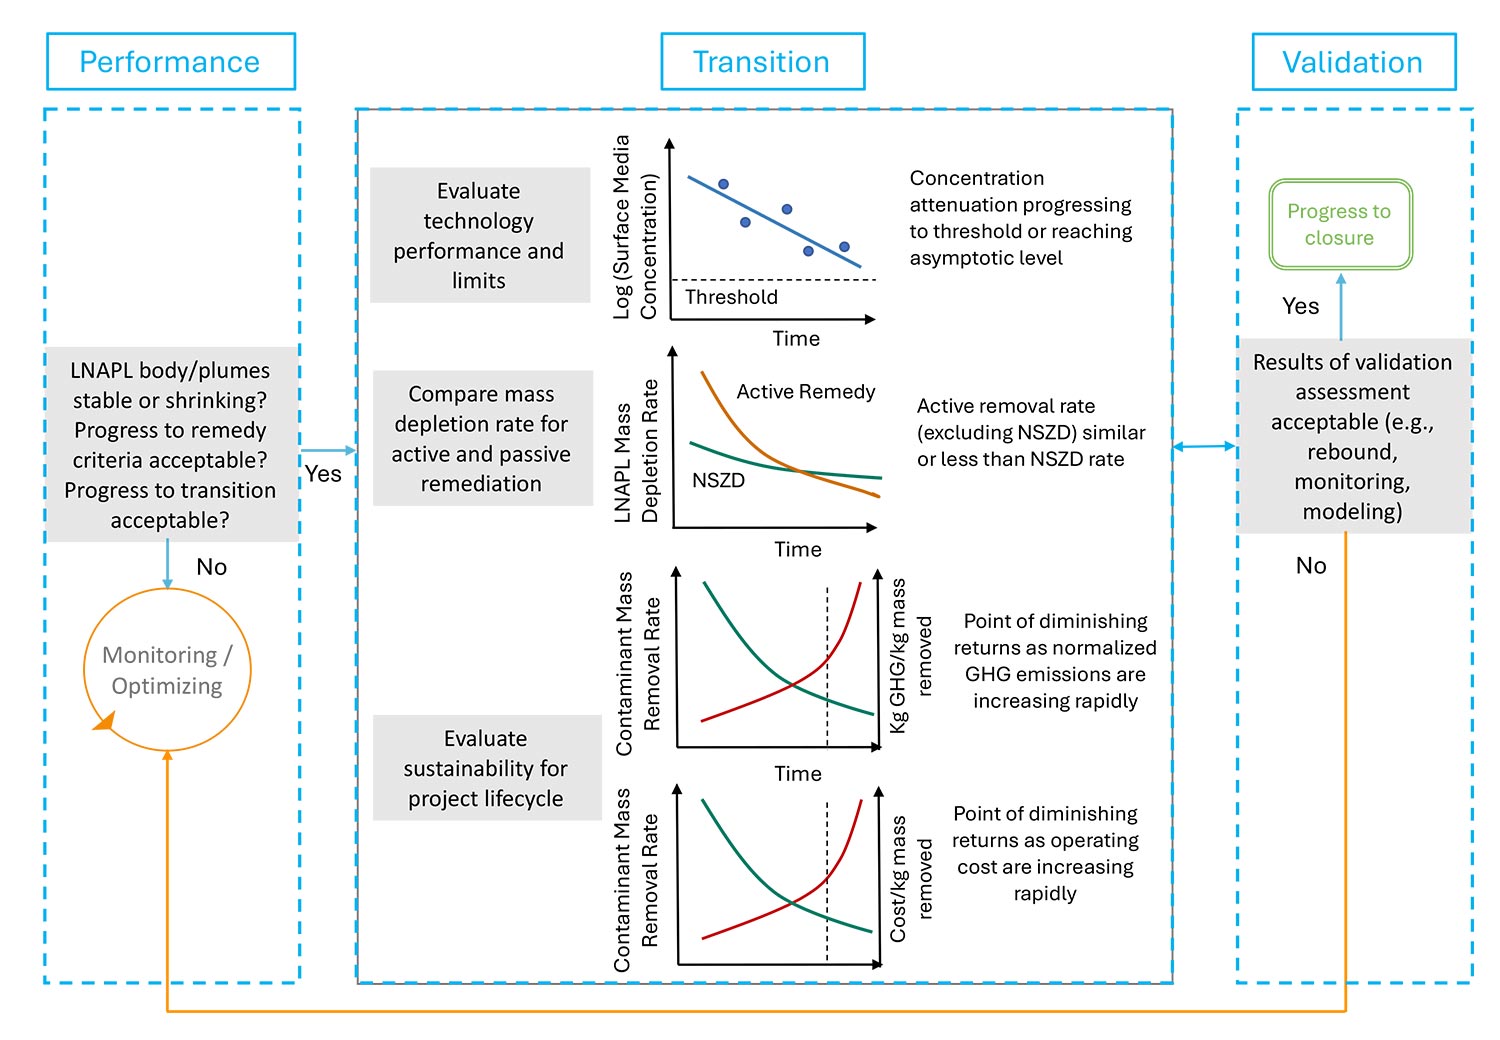
Stage 4: Transition Assessment (Active Systems) & Validation
The performance of active remediation should be evaluated relative to remedial goals established in Stage 1 and related performance metrics defined in Stage 3. These goals often shift over the course of remediation. For example, the focus may initially be on LNAPL mobility and recovery, when transition thresholds include LNAPL recovery rate approaching asymptotic levels and/or LNAPL transmissivity reaching a practical limit of hydraulic recovery. During latter stages of active remediation, achieving or approaching compositional thresholds related to concentrations (e.g., MCLs) and/or mass discharge or mass loading may become the focus. Technology limits are reached, for practical purposes, when monitoring data indicate relevant subsurface metrics are asymptotically approaching the defined transition thresholds (Figure 2). Depending on the complexity of site conditions, history and the remedial system, more rigorous statistical analyses may be needed to quantify uncertainties and support decision making.
Transition Assessment
- technology performance and limits;
- a comparison to the baseline assessment; and,
- an evaluation of sustainability metrics (cost, GHG emissions, etc.).