Appendix I – SVE Technology Description
ESTCP (2002) Air Sparging Design Paradigm
- Site characterization and development of site conceptual model
- Preliminary feasibility assessment
- Pilot testing
- Design
- Monitoring
The pilot testing is divided into two approaches, 1) standard design approach and 2) site-specific design approach. For each of these two approaches there are default designs and recommended monitoring. The flow chart for air sparging design including pilot testing is shown in Figure B-1.
The standard design approach recommends the following data collection: injection pressure versus flow rate test, transient pressure response test, dissolved oxygen measurements, helium tracer test and soil gas sampling. Based on this data set, injection wells based on 15 ft centers and 20 ft3/min injection rate are recommended. The site-specific design approach recommends the standard methods plus sulphur hexafluoride tracer test to assess air distribution more accurately.
Overview of Technology
The phase change and mass removal typically decrease during the treatment life cycle. During early stages of remediation, the primary mass removal is from air pathways of low resistance (higher permeability soils), where chemicals in adsorbed phase or non-aqueous phase liquids (NAPL) partition into the moving air. Contaminants in lower permeability soils will not be removed by advection because soil vapors will preferentially flow through higher permeability soils. When the mass in higher permeability soils becomes mostly depleted, the rate of mass removal may approach a low value or cumulative mass recovery may approach an asymptotic value. This is because contaminants in lower permeability silts and clays and within the capillary fringe, if present, must desorb and diffuse into an advective flow path before they can be removed by the SVE system. If the rate of diffusion is slow, the time duration for removing VOCs may be significantly extended (US EPA 1991). US EPA (2018) describes a two-compartment model (coarse- and fine-grained) for prediction of concentrations and clean-up times when there are mass transfer limitations resulting from slow diffusive transport in fine-grained soil layers.
The addition of air through SVE may result in enhanced aerobic biodegradation and consequently SVE is closely related to bioventing (refer to Bioventing Factsheet). Because there is often contamination at or below the water table, remediation through air sparging will often be an additional component to the SVE system.
Exit Strategy Toolkit
Bioventing Factsheet
This factsheet provides information to support remedial decision-making on bioventing. The information is intended to help:
a) optimize the performance of bioventing; and,
b) transition from bioventing to natural attenuation, “no further action” (NFA) or site closure.
This factsheet should be read in conjunction with the overarching Compendium factsheet that provides a broader context on the application of bioventing within a framework for remedial decision making.
This factsheet is not intended to provide detailed guidance on bioventing and assumes that a sufficient detailed conceptual site model (CSM) has been developed and bioventing has been selected as an appropriate technology to meet agreed remedial concerns and objectives (Appendix I and Appendix II). Additional details on bioventing design and implementation can be found in Hinchee and Ong (1992), US EPA (1995a), US EPA (1995b), US ACE (2002), US AFCEE (2004), ESTCP (2004), ESTCP (2006), ITRC (2018), Smith et al. (2023) and Federal Remediation Technologies Roundtable (FRTR) guidance. The information found in the appendices and reference materials can be extremely helpful in supporting remedy implementation and facilitating the acceptance of risk-based approaches.
Bioventing - Technology Summary
Bioventing is a remedial technology that aims to enhance biodegradation of soil impacted with petroleum hydrocarbons (PHCs) or other aerobically degrading contaminants through addition of air to the vadose zone. Specific bioventing mechanisms include increased oxygen supply to aerobic zones resulting in increased biodegradation rates, and conversion of previously anaerobic LNAPL zones near water tables to aerobic zones and aerobic biodegradation of reduced hydrocarbons. Bioventing may be used to target a composition-based remediation concern through treatment of soil or soil gas contamination and may in some cases be effective in changing the LNAPL composition and reducing a LNAPL source. Bioventing is often implemented through injection of air into the subsurface at rates designed to optimally provide O2 for biodegradation while minimizing volatile PHC migration and emissions to buildings and the land surface. Bioventing is suitable for a wide range of types of PHCs from gasoline to heating oils. For light molecular hydrocarbons such as gasoline, volatilization may be more important than biodegradation, and consequently bioventing is often implemented in conjunction with soil vapor extraction (see SVE Factsheet). The focus of bioventing often is (but should not exclusively be) PHCs with greater than 8 carbon atoms (n-C8+ for n-alkane equivalent carbon chain lengths) such as jet fuels, diesels, and heating oils. Appropriate precautions must be taken to control volatile emissions. If there are any potential health and safety concerns associated with air injection and volatile chemical migration (e.g., to buildings or other sensitive structures), air should be extracted and not injected. Additional information on bioventing is provided in Appendix I.
Remedial Concerns and Objectives
The remedial objectives may also include target timelines to achieve the risk-based threshold. Broader remedial decision making should also factor in potential liabilities associated with site risk, regulatory requirements, business plans and timelines, future redevelopment potential, sustainability, and economic factors. The remedial objectives should also incorporate the notion of technical practicability.
At many sites, bioventing is applied as part of a treatment train approach to remediation that begins with a saturation-based concern and goal to reduce light non-aqueous phase liquid (LNAPL) saturations to a practical limit (e.g., below a specified transmissivity threshold). This saturation-based concern and goal may be followed by a composition-based concern and goal to reduce the total mass of hydrocarbons or COCs. These objectives may begin with soil vapor extraction (SVE), followed by bioventing as an optimized and more sustainable technology. The overall remedial strategy can often be improved by implementing bioventing as an interim remedy when transitioning from active remediation (e.g., SVE) to natural attenuation (or natural source zone depletion – NSZD), NFA, or site closure. It is important to note, however, that bioventing can also be used to reduce mobile LNAPL through a steep vertical concentration gradient within the capillary fringe and to promote wicking (API 2018; Appendix II). Bioventing may also be conducted in conjunction with biosparging, a complementary technology to address contamination below the water table (see Air / Bio Sparging Factsheet).
Monitoring of Natural and Enhanced Biodegradation
Bioventing or enhanced biodegradation in the unsaturated zone is a complementary technology to natural source-zone depletion (NSZD). An integrated monitoring strategy that includes baseline NSZD rate measurements such as CO2 efflux and/or subsurface temperature to estimate PHC depletion rates under natural and enhanced conditions should be considered (see the Compendium and Natural Attenuation Factsheets). These data, coupled with conventional in-situ respiration testing (see Appendix II) should be factored into the establishment of remedial goals, performance metrics and transition thresholds.
Performance Metrics
System Metrics
- Air flow rates at individual injection wells and header and system run-time
- Pressures at individual extraction wells and the system header and subsurface monitoring points
- Air temperature of injected air (in gas) and/or ground temperatures using appropriately located thermistors (optional)
Bioventing Modeling Tools
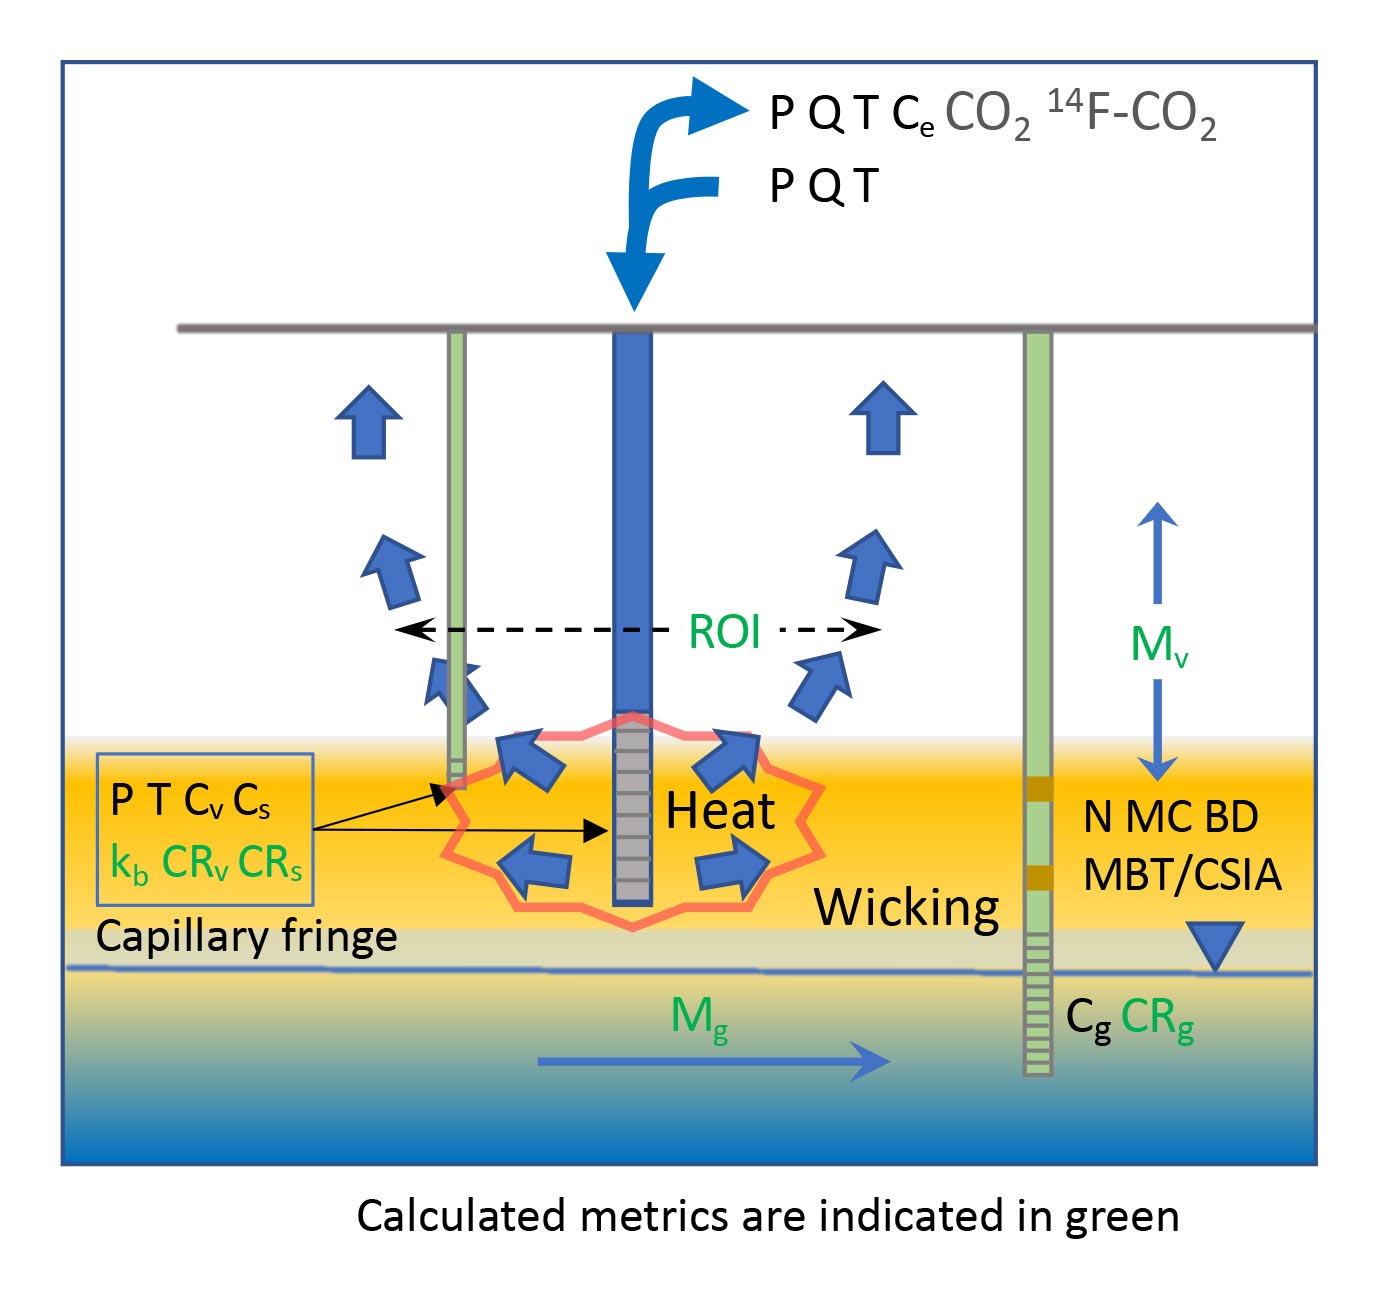
Performance Metrics
- Cs = Soil concentration
- Cg = Groundwater concentration
- Cv = Soil vapor concentration
- CRs CRv CRg = Concentration ratios
- Mg = Groundwater mass flux or discharge
- Mv = Soil vapor mass flux or discharge
- Kb = In-situ respiration rate
- T = temperature
- MC = soil moisture content
- BD = soil bulk density
- N = nutrient levels (optional)
- MBT/CSIA = molecular biological tools/ compound specific isotope analysis (optional)
- Q = Air flow rate
- P = Pressure
- T = Temperature (optional)
- ROI = Radius of influence
- Ce = Concentration effluent (if air extraction)
- CO2, 14F-CO2 (if air extraction)
If air is extracted, biodegradation rates may be estimated from data on total petroleum hydrocarbon (TPH) and fixed gas (O2, carbon dioxide – CO2, methane – CH4) concentrations in extracted soil gas and air flow rates. If warranted, testing of radiocarbon (14C) in CO2 can be used to estimate the relative proportion of biodegradation of petroleum hydrocarbon versus naturally occurring organics as radiocarbon distinguishes between PHC degradation and natural organic degradation (see Natural Attenuation Factsheet). Additionally, volatilization rates may be estimated from measured volatile organic compound (VOC) concentrations in extracted soil gas.
Subsurface Metrics
- Concentrations of soil, groundwater and soil vapor (see Table 1)
- Mass flux or discharge in groundwater and/or soil vapor
- In-situ respiration tests to estimate biodegradation rates for both TPH and individual COCs
- Soil moisture content and bulk density (for degradation rate estimates)
- Temperature of soil and groundwater
- Nutrient levels (optional, see Appendix IV for discussion)
- Molecular biological testing (MBT) and compound specific isotope analysis (CSIA) (δ13C and δ2H) to provide evidence for biodegradation and significance of co-occurring depletion mechanisms (e.g., volatilization vs. biodegradation) (optional)
- Radiocarbon (14C) analysis to distinguish between CO2 produced from PHC degradation versus natural organics (optional)
Temperature Monitoring
Temperature is an important metric because biodegradation rates are affected by temperature and increased temperature (and heat generation) is an indicator of biodegradation. Complementary methods such as solarization (heating using plastic) or hot-air or hot-water injection can also increase PHC biodegradation. For example, based on the Arrhenius relationship and Q10 relationship, biodegradation rates are expected to increase over the temperature range for mesophilic bacteria (up to 45oC) by a factor of 2−3X for every 10oC increase in temperature (U.S. EPA 1995a,b; Suarez and Rifai 1999; Alberta Environment 2005; Ulrich et al. 2010). Biodegradation rates can be estimated from the increase in soil temperature (Mohr and Merz 1995). Methods for measuring temperature in the subsurface include use of thermocouples, thermistors, and button-type technology (with built-in data logger). Temperature sensors can also be deployed in backfilled boreholes or open pipes (e.g., monitoring wells) (Sweeney and Ririe 2014). If deploying in open pipes, it is important to consider the potential for thermal convection and whether data is representative of soil. Given new technology for monitoring and data acquisition, temperature monitoring is increasingly becoming more accessible (see Natural Attenuation Factsheet).
Soil gas concentration data are commonly used to gauge performance of a bioventing system and overall site risk. The concentration data can be evaluated for individual chemicals or as ratios (e.g., preferential attenuation of lighter molecular weight hydrocarbons can indicate reduced risk – ITRC 2009a). Mass-based estimates can often represent a more accurate indication of risk than concentration criteria when evaluating bioventing performance (ITRC 2010). Understanding how mass-based estimates are defined is important, which are mass flux – mass per unit area per time, mass discharge – mass per time crossing plane of interest, and mass loading – mass per time at intersection of plume and receptor (see SVE Factsheet for additional details).
Baseline measurements of concentrations of fixed gas associated with PHC biodegradation (O2, CO2, and CH4) should be conducted to evaluate the potential for bioventing technology to be successfully implemented. Baseline oxygen concentrations in areas of residual LNAPL contamination should ideally be less than 1% and a maximum of 5%. An in-situ respiration test should generally be conducted prior and during remediation to estimate biodegradation rates (Appendix II). The test involves injection of air and a helium tracer followed by monitoring of fixed gases and tracer after injection ends. Because the migration of methane into the respiration test zone can affect estimation of biodegradation rates, it is important to characterize soil gas methane and dissolved methane if degassing and ebullition are potentially occurring (Appendix II). Knowledge of sources and the soil gas CSM can be used to assess oxygen respiration data and biodegradation rates. When vadose zone contamination is mostly degraded, but methane is migrating upward from an anaerobic saturated zone, the oxygen respiration rates may mostly represent methane degradation. When methane degradation is the primary process, the CO2 to O2 concentration ratios (or ΔCO2/ΔO2) are expected to be close to 0.5 (possible application of soil gas ratios as a transition threshold is discussed in Appendix V). Additional performance data may include temperature, soil moisture content and/or nutrient levels.
In general, bioventing performance should be evaluated relative to the following key metrics:
- time to achieve objectives
- cost (e.g., $/kg HC degraded)
- greenhouse gas emissions (GHG) or other quantifiable sustainability metrics (e.g., kg CO2 emissions/kg HC degraded)
Additional information on bioventing system pilot testing, passive bioventing systems and optimization and process-based model for interpreting soil gas data is provided in Appendix II, Appendix III and Appendix IV and Appendix V, respectively.
Transition Thresholds
Transition thresholds are comprised of remedial objectives and relevant performance metrics. The transition thresholds are used to support remedial decisions related to transitioning to another remedial technology or terminating active remediation altogether. Like performance metrics, the transition thresholds should be established and agreed with all relevant stakeholders prior to the onset of bioventing.
The decision to terminate bioventing requires confidence (multiple lines of evidence – MLE) that remedial objectives have been met and/or the technology has reached its limit of efficacy. This decision process can include evaluation of whether rates of natural hydrocarbon attenuation are estimated to be sufficient to meet remedial objectives after the system has been turned off. In this context, estimates of mass discharge and mass loading from monitoring data can be useful when the objective of bioventing is to address risk from soil vapor and/or groundwater pathways (Truex et al. 2013; US EPA 2018; see SVE Factsheet).
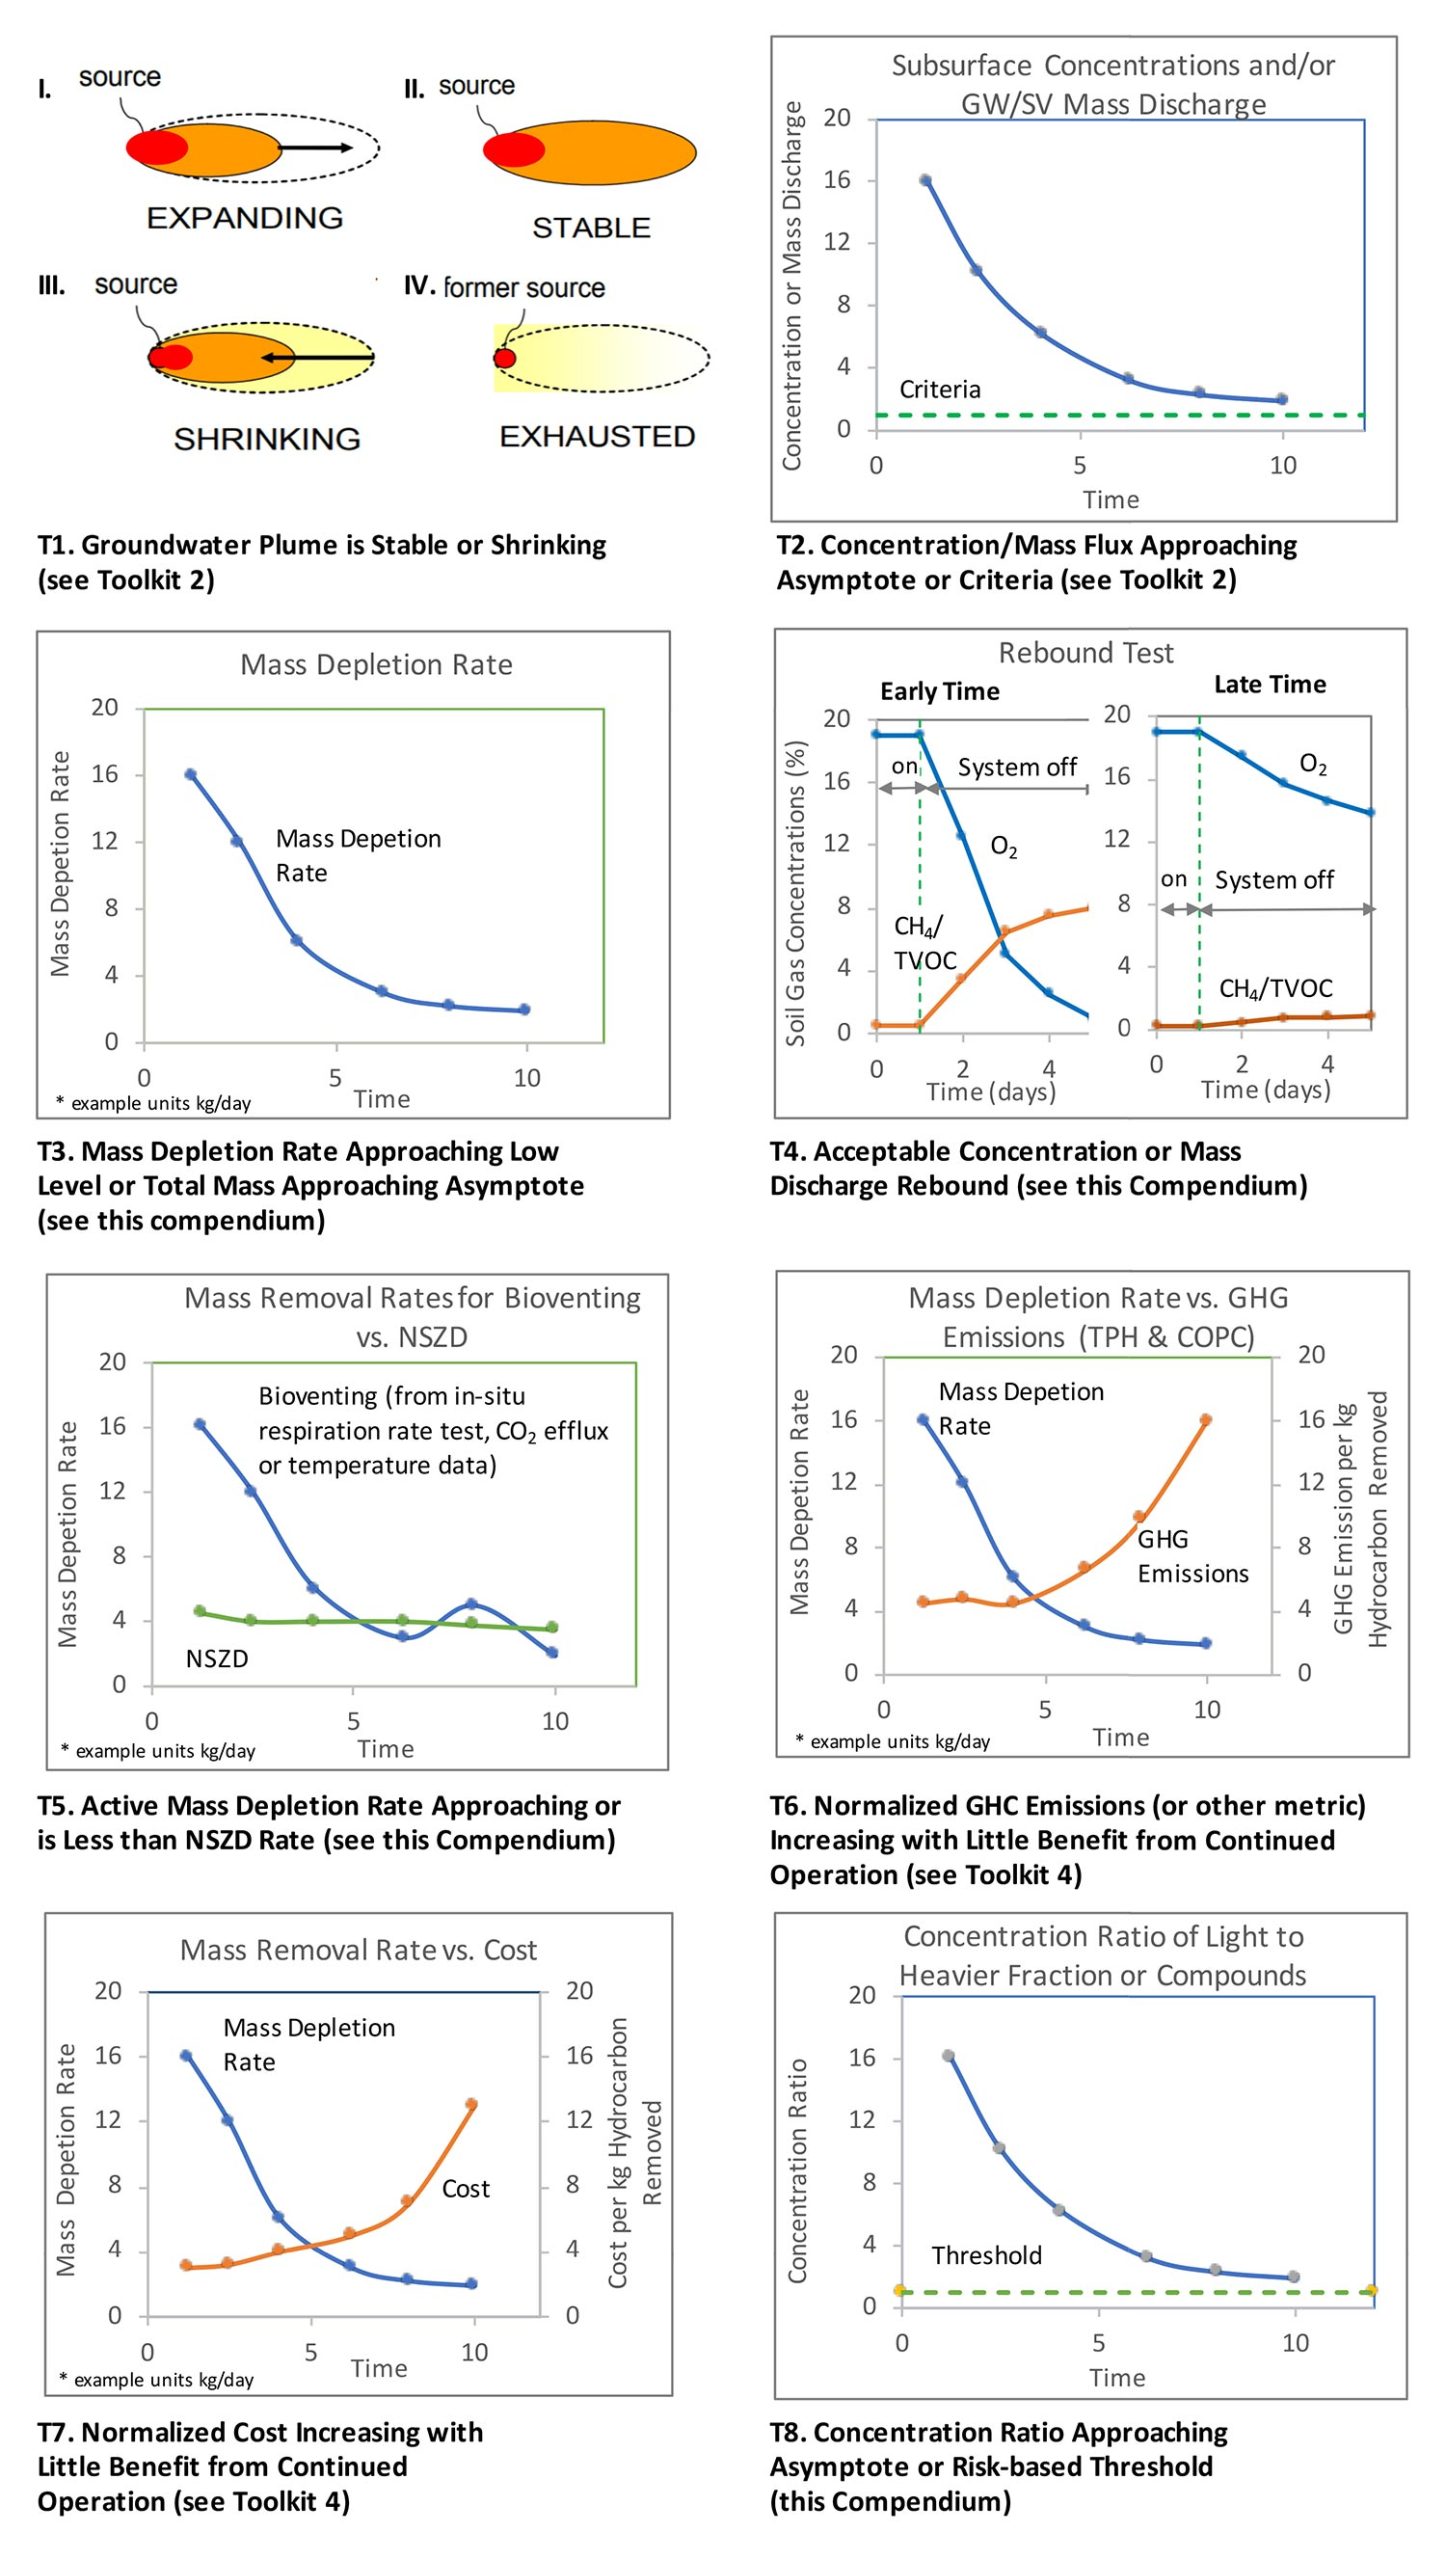
The following are 8 transition thresholds (T1 to T8) that can be used as MLE to support transitions from active remediation to another active remediation system, natural attenuation, “no further action”, or site closure (see Table 1 and Figure 2):
T1. Stable or shrinking dissolved groundwater and soil vapor plumes.
T2. Subsurface concentrations and/or mass flux, mass discharge or mass loading less than or approaching defined risk-based or regulatory criteria (i.e., where MNA is expected to “finish the job”)1.
T3. Mass depletion rates associated with active remediation approaching low limits or cumulative mass depletion reaching asymptotic levels indicating reducing efficacy of remediation.
T4. Minimal or acceptable rebound (i.e., stability) based on monitoring of groundwater or soil vapor concentrations, or mass discharge or mass loading after the system is turned off.
T5. Bioventing attenuation rates similar to natural attenuation rates (mass or concentration attenuation). A common threshold is bioventing mass depletion rates (e.g., from in-situ respiration test) similar to NSZD rates for total hydrocarbons or individual COCs. Mass depletion rates can be compared based on an area normalized rate in units of mass per time-area or for a representative “Site” or LNAPL-impacted area in units of mass per time. See Appendix II for how to adjust in-situ respiration rates to enable comparison to NSZD rates and to correct rates for methane oxidation.
T6. Decreasing mass depletion rates and corresponding GHG emissions (or other quantifiable sustainability indicators) per mass of contaminant depleted that are increasing exponentially.
T7. Decreasing mass depletion rates and corresponding costs per mass of contaminant depleted that are increasing exponentially.
T8. Preferential loss of lighter molecular weight hydrocarbons (e.g., risk-drivers such as benzene) from groundwater or LNAPL and/or ratios of light to heavy molecular weight hydrocarbons that have reached asymptotic levels and/or risk-based thresholds.2
The transition metrics should be selected depending on site conditions and project requirements. While a comprehensive list of thresholds is provided to provide flexibility in options, typically only a smaller subset of thresholds or in some cases a single primary threshold may be warranted. Depending on the site, a MLE approach can improve confidence and acceptance of the transition, and often can be achieved through analysis of readily available data collected during the remediation life cycle.
Remediation Validation
The process for system shutdown and rebound monitoring should be agreed upfront with all key stakeholders, preferably before the bioventing system is first turned on, and as a minimum prior to turning off the system (i.e., as transition thresholds are becoming imminent).
| Metric | Locations/Frequency | |
|---|---|---|
| Performance Metrics | ||
| System | ||
| P1. Air flow rates at injection wells and system header | ||
| P2. Pressures at injection wells and header and subsurface monitoring points | ||
| P3. Temperature of injected air (optional) | ||
| Subsurface | ||
| P4. Soil, groundwater and soil gas concentrations* at monitoring locations | ||
| P5. Groundwater and soil vapor mass flux and mass discharge | ||
| P6. In-situ respiration tests | ||
| P7. Soil moisture content and bulk density | ||
| P8. Temperature of soil and groundwater | ||
| P9. Nutrient levels (optional) | ||
| P10. Molecular biological testing (MBT) and compound specific isotope analysis, radiocarbon (14C) analysis (optional) | ||
| Transition Thresholds | ||
| T1. Stable or shrinking groundwater and soil vapor plumes (consider statistical tools such as Mann-Kendall, regression and spaciotemporal plume or mass analytics) | ||
| T2. Subsurface concentrations and mass flux, discharge or loading are at or approaching criteria | ||
| T3. Mass depletion rates approaching low levels (or total mass approaching asymptotic level) | ||
| T4. Minimal or acceptable rebound | ||
| T5. Mass depletion rates during bioventing operation approaching natural attenuation (e.g., NSZD) rates | ||
| T6. Decreasing mass depletion rates while normalized GHG emissions are increasing | ||
| T7. Decreasing mass depletion rates while normalized costs are increasing | ||
| T8. Compositional change indicating decreasing light fraction as indicated by concentration ratios | ||
Table 1 - Summary of Example Performance Metrics and Transition Thresholds (select applicable metrics and thresholds as needed)
Appendix I – Description of Bioventing Technology
Technology Overview
The biodegradation capacity of introduced oxygen is relatively large. Based on a simple partitioning calculation, the dissolved oxygen (DO) concentration in water at 20oC that is exposed to atmospheric oxygen (~20%) is approximately 8 mg-O2/L-water. Assuming single-component partitioning for benzene and stoichiometric requirement of 3.5 mg-O2/mg-benzene oxidized, results in the oxidation of 2.7 mg-benzene/L-water. This corresponds to a benzene vapour concentration of 0.41 mg-benzene/L-air (at 150C) or about 145 ppm-benzene in air (at 15oC, 1 atm) based on equilibrium partitioning.
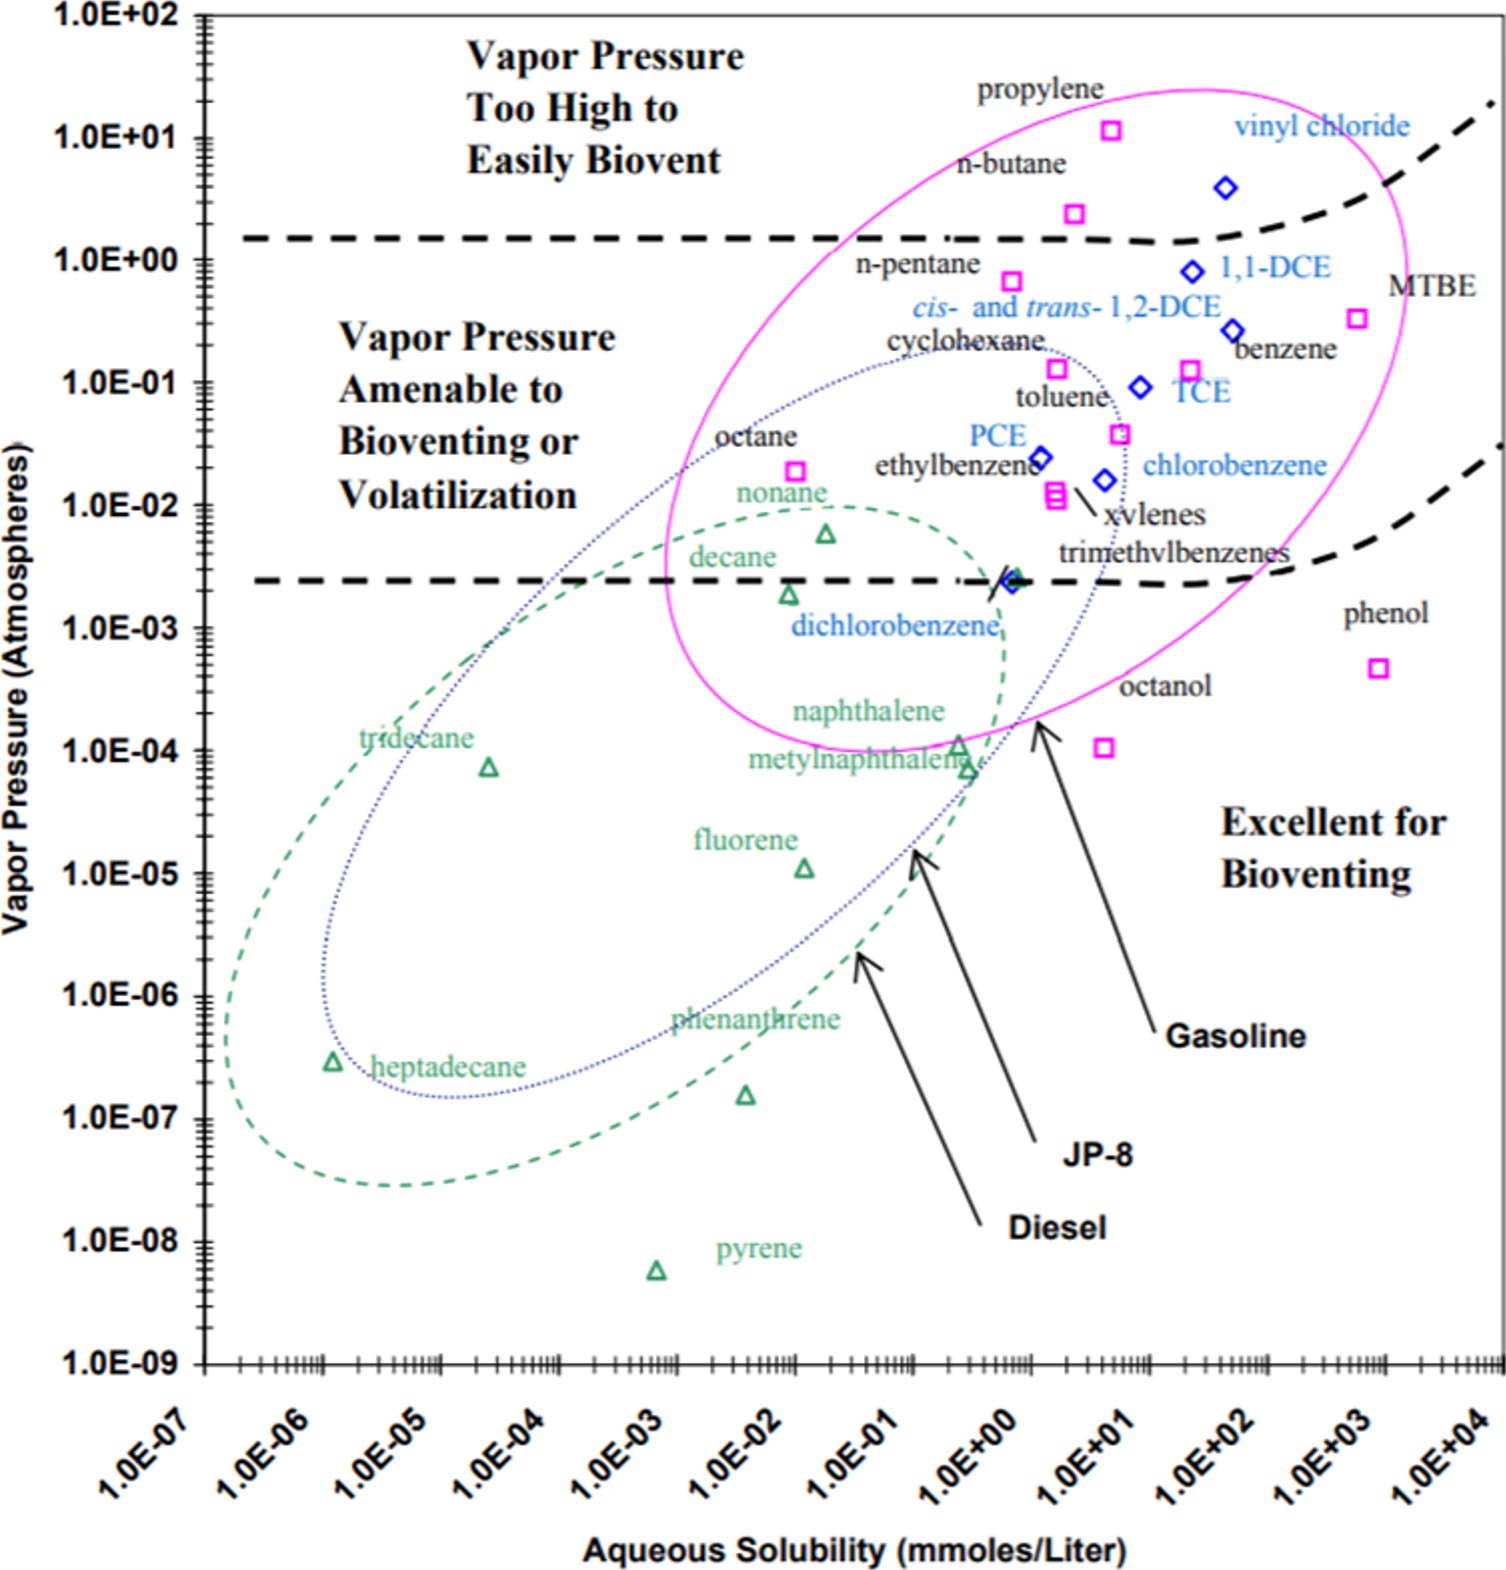
Bioventing is suitable for a wide range of types of PHCs from gasoline to heating oils. For light molecular hydrocarbons such as gasoline, volatilization may be more important than biodegradation. Consequently, bioventing applications often focus on PHCs with greater than 8 carbon atoms (n-C8+ for n-alkane equivalent carbon chain lengths) such as jet fuels, diesels, and heating oils. The relationship between contaminant physicochemical properties and the potential for bioventing is shown in Figure I-1. Bioventing has been successfully used at gasoline impacted sites, but appropriate precautions must be taken to control emissions. If there are any potential health and safety concerns associated with air injection and volatile chemical migration (e.g., with buildings or other sensitive infrastructure), soil gas should be extracted using SVE.
The key data required to build the CSM for bioventing applications in addition to basic requirements for biodegradability and oxygen availability include PHC type and composition, the LNAPL distribution, the depth to the water table, water table fluctuations, soil stratigraphy, soil texture and particle size gradation, organic carbon content, soil moisture, soil bulk density, soil-air permeability, soil temperature, subsurface infrastructure (e.g., utilities), subsurface infrastructure including buildings and surface cover and unusual site factors that could affect biodegradation (e.g., very high or low pH, potential toxic co-contaminants). Soil nutrient levels are optional data that may be considered for optimization. Soil moisture content and soil bulk density may be estimated from soil texture and particle size gradation although measurement data can be obtained when warranted.
Aerobic Biodegradation Basics
Lessons Learned from Multi-site Field Trials
Analysis of the above pilot tests was conducted by the US Air Force Centre for Environmental Excellence (US AFCEE 1996; US AFCEE 2004). A key finding was that the average initial degradation rate was 1,200 mg of total petroleum hydrocarbon (TPH) degraded per kilogram (kg) of soil per year. After one year of bioventing, the rate had dropped to an average of 700 mg TPH per kg soil per year. The decrease was attributed to a decrease in hydrocarbon bioavailability over time. The lower molecular weight compounds such as BTEX will quickly biodegrade, leaving the less soluble higher molecular weight compounds to degrade at a slower rate. While some reduction in rate due to reduced bioavailability is not unexpected, an alternative hypothesis is that initial methane concentrations may have been elevated, which may have contributed to the higher initial respiration rates. It is not possible to test this hypothesis based on the available data from these pilot tests.
Additional observations and lessons learned from the U.S. Air Force Bioventing Initiative and the U.S. EPA Bioremediation Field Initiative include that air injection was the preferred method of oxygen supply. Extraction of air was performed at five sites impacted with gasoline because of high vapour concentrations. However, a significant reduction in vapour concentrations was observed over the first 3 to 6 months of operation. Consequently, it was observed that it may be possible to convert an extraction system to an injection system once conditions are safe.
The results of soil sampling and analysis before bioventing and after one year of operation indicated significant differences in removal rates depending on hydrocarbon compound. For example, on average, there was a 97% reduction in BTEX concentrations, but only a 24% reduction in TPH concentrations. These data indicate bioventing can be effective in meeting a compositional objective where the lower molecular weight, more soluble compounds are targeted, which are also often the risk drivers.
Appendix II – Bioventing Pilot Testing and In-situ Respiration Rates
Bioventing Pilot Testing
- Determine baseline soil gas concentrations of O2, CO2, CH4 and volatile PHCs.
- Use a blower system to inject air into a central injection well and determine how far and fast oxygen moves into the surrounding soil and estimate a radius or zone of pressure and oxygen influence (airflow and zone of influence test).
- Turn off the air supply and use soil gas measurements at monitoring probes to quantify the rate of oxygen consumption in the soil gas (in-situ respiration rate test).
The second and third steps, estimation of the air flow rate and zone of influence, and in-situ respiration rate test, are often conducted in tandem. The zone of influence is characterized in two parts: the zone of pressure response and zone of oxygenation, which may be defined on the basis of the target O2 flux or pore volume O2 flushing rate. The relationship between pressure and O2 flux can be complex and detailed analysis is beyond scope of this appendix. The scale of the test may vary from a smaller scale test conducted over a few days to a larger scale test conducted over a few weeks. Longer term tests can be advantageous when data over a larger spatial scale is required or when the test is performed at a site with lower permeability soils where it may take longer for O2 to migrate to the desired spatial extent within the formation.
A smaller scale in-situ respiration test typically involves injection at a smaller number (often 2 to 3) injection points screened over short vertical intervals within the vadose zone that are located within areas of contamination (Hinchee and Ong 1992; US EPA 1995a,b). Injection of air at a flow rate of 60 to 100 cubic feet per hour (cfh) for 24-hours has historically been recommended. A 1/3 HP blower may be suitable for this purpose. The air should include an inert tracer (e.g., 1-2% helium) to evaluate whether the O2 decline is through advection and dilution rather than biodegradation. During injection, data on air flow rate and pressure can be used to estimate the soil-air permeability. Once O2 concentrations at probes are between 10 to 15% (or more), the blower may be turned off, and subsequently, monitoring of fixed gases, O2, CO2, CH4, and a tracer, are conducted until O2 decreases to below 5%, which may involve monitoring for a 2- to 3-day period. Typically, an in-situ respiration test should also be conducted in a background area without contamination, but with similar soils and soil organic carbon content. The test program may also include monitoring of temperature, and collection and analysis of soil samples for PHC concentrations, physical properties and nutrients.
Initial scoping calculations should be performed to assess oxygen requirements based on stoichiometric requirements to degrade the TVOC soil gas concentration and additional VOCs that may desorb during the oxygenation process. For larger sites with initial high TVOC concentrations (included elevated methane concentrations), much higher air injection rates and longer injection times may be required than specified above. Depending on the site conditions, a short-duration in-situ respiration test may be infeasible and either a longer-duration test or other methods (e.g., temperature monitoring) may be preferred to estimate rates.
A longer duration, larger scale test includes the same steps and monitoring as conducted for the shorter duration test, except that monitoring is conducted at additional probes that are located at varying distances from the injection point. Air injection is also conducted over a longer time. Through monitoring of pressure and O2 concentrations, additional data can be obtained on radius of influence and design parameters required for full-scale system design. Such data may help optimize the design and save on costs.
Estimation of Biodegradation Rates
The respiration rate from O2 depletion is calculated as follows:
The radius of influence (ROI) for biodegradation may be estimated using uniform box reactor model (or alternately the required air flow may be estimated from the ROI):
Biodegradation Rates from Oxygen Data
Q = extracted soil gas flow rate (ft3/min)
Qbsg = oxygen concentration in background soil gas (%)
Qesg = oxygen concentration in extracted soil gas (%)
The above equation is based on atmospheric pressure at sea level and assumes 3.5 lbs of oxygen is required to degrade 1 lb of petroleum hydrocarbon (US AFCEE 2001).
In-situ Respiration Rates from Multi-site Field Trials
To obtain total depletion rates, the calculated values need to be multiplied by the thickness of contaminated soil in feet as follows:
Equivalent Degradation Rate (US Gal/acre-year) = kB-O2 x bn x (pblk/pn) x 390
Where bn = thickness of contaminated soil (m); pblk = bulk density soil (kg/L) and pn = density of NAPL (kg/L)
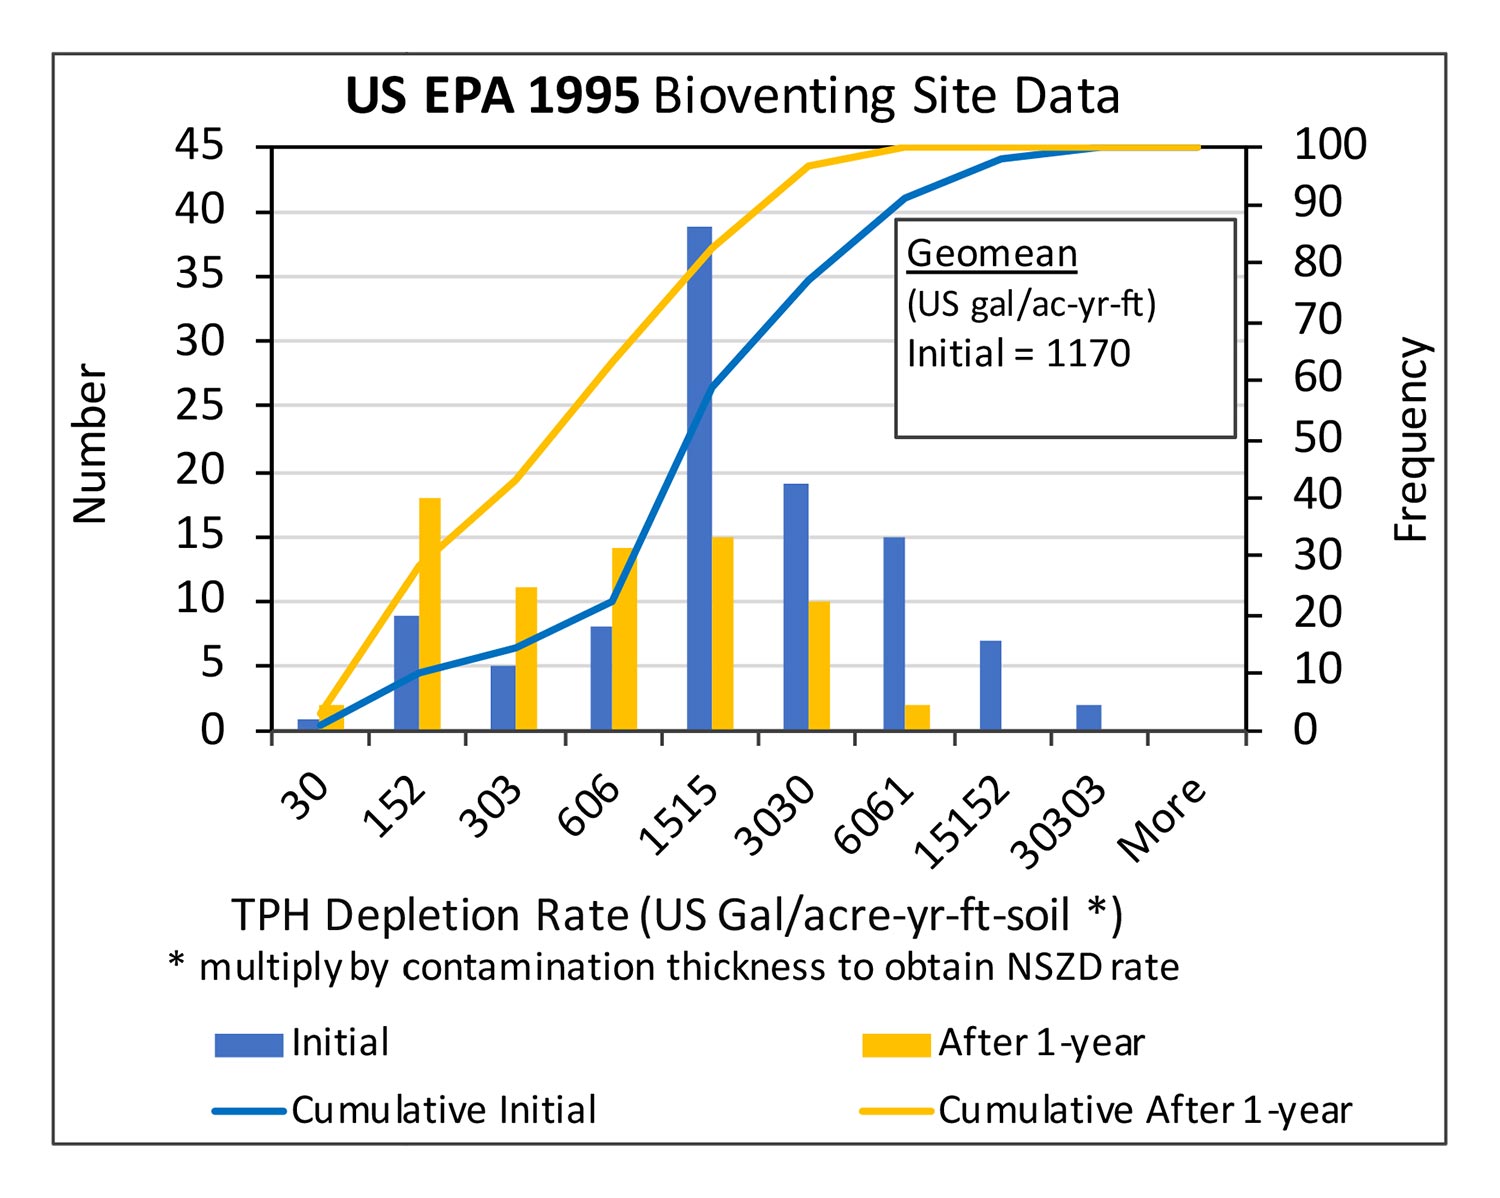
There are limited data on contaminated soil distribution at five well-researched field sites (US EPA 1995a). These data indicate varying contaminated soil thickness ranging from on the order of 1.5 to 21 m. For illustration purposes, equivalent degradation rates are calculated assuming a bn of 1.5 to 21 m, a one-year geometric mean kB-O2 of 353 US Gal/acre-yr-m (Figure II-2), a pblk of 1.6 kg/L and pn of 0.8 kg/L. Based on the one-year bioventing rates, this corresponds to 1,700 to 24,000 US gal/acre-year, which is approximately 1.5 to 2 times higher than published median NSZD rates at the lower end, and an order of magnitude higher at the upper end (Palaia 2016; Garg et al. 2017; Kulkarni et al. 2022; these studies report median rates of ~1,000 to 1,100 US gal/acre-year). The comparisons suggest rates at some bioventing sites are higher than typical NSZD rates.
The calculation is useful in conceptually showing how bioventing and NSZD rates can be compared. However, comparisons should be carefully interpretated as source zones and processes quantified in bioventing and NSZD rates may be different. Additional data on comparisons between hydrocarbon depletion rates for bioventing and NSZD are needed to assist in developing an improved transition strategy for this technology.
Recent Developments
Microbial Biological Tools
MBTs are increasingly being used as a line of evidence in evaluation of enhanced natural and enhanced biodegradation (ITRC 2011). Common objectives and corresponding tools include 1) Are contaminant degrading microbes present and, if so, how many? – Quantitative polymerase chain reaction (qPCR) testing of target genes based on DNA or RNA methods; 2) Is biodegradation of contamination occurring? – Compound specific isotope analysis (δ13C and δ2H) and 3) what microorganisms are present? – Metagenomics including next generation sequencing. A combination of gene assays and CSIA can be used to assess evidence for biodegradation and significance of co-occurring depletion mechanisms (e.g., volatilization vs. biodegradation). Stable Isotope Probing can be used to prove degradation of compounds used as a carbon and/or energy source. Testing of DNA or mRNA can be valuable because it can be diagnostic of functional genes involved in contaminant-specific degradation and redox conditions under which degradation occurs (Bouchard et al. 2018). The rationale and requirements for this testing is project- and contaminant-specific decision.
The CH4 concentrations should be measured during in-situ respiration tests. If increasing, the degradation rate from CH4 generation can be estimated as follows:
3CH3COO– + 3H+ → 3CO2 + 3CH4
3H2 + 0.75CO2 → 0.75CH4 + 1.5H2O
C6H6 + 4.5H2O → 2.25CO2 + 3.75CH4
In addition to soil gas CH4, monitoring of dissolved CH4 should be considered when degassing and ebullition are potentially occurring. Measurement of total dissolved gas pressure measurements can provide information on degassing and contaminant degradation processes in groundwater (Roy et al. 2017).
Case Studies Comparing Technologies
Appendix III – Passive and Solar-Powered Bioventing
Passive Bioventing by Barometric Pumping
ESTCP (2000) present the results of a pilot study of passive bioventing where short-term air flow rates as high as 20 cfm occurred during the weather front changes and air flow rates as high as 12 cfm occurred during the diurnal changes. ESTCP (2004) report varying performance from tests at multiple sites with the best sites achieving short-term air flow rates that were as high as 5-15 cfm and a radius of influence > 10 ft. However, at a few sites, the minimum performance criteria for air flow rate of 1 cfm was not met through passive bioventing.
The primary driving force for passive bioventing are daily fluctuations in atmospheric pressures that while variable depending on geographic location and weather may be on the order of 750 Pa per day. Air flow is induced through the lag in pressure response between surface and subsurface soil and the resulting pressure gradient.
ESTCP (2004) and ESTCP (2006) describe how specific subsurface lithologic and stratigraphic conditions must exist for any change in barometric pressure to induce significant airflow through vent wells. Two generic site types where passive bioventing works best are a thick (e.g., >100 ft thick) relatively homogeneous coarse-grained layer of soil with high soil-air permeability (uncapped scenario) or a thinner relatively low permeability surface layer consisting of fine-grained soil and/or paved surface underlain by a coarser-grained layer where contamination to be treated is present (capped scenario). Often paved surfaces have cracks or other openings and on their own may not be of sufficiently low permeability to induce a pressure gradient. A commonly used rule of thumb for application of passive bioventing is that the radial soil-air permeability should be greater than 100 millidarcy (~1E-09 cm2) (ESTCP 2006). Sandy soils are most suitable for passive bioventing.
ESTCP (2006) provide detailed information on the design of passive bioventing systems including methods for site selection, data on average seasonal diurnal pressure differences for different regions of the USA, predicted air flow rates and the air flow rates needed to sustain aerobic biodegradation. One commercially available one-way valve is a BaroballTM, supplied by Durham Geo Slope Indicator.
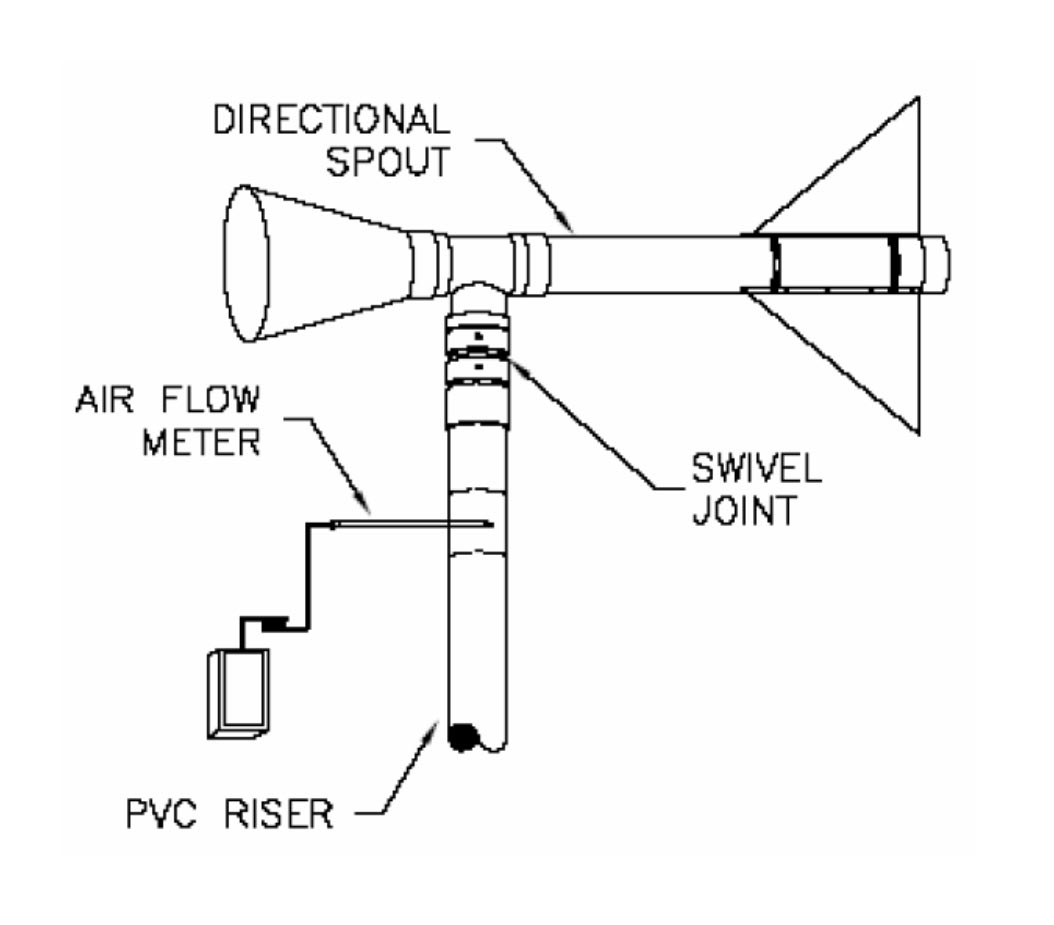
Passive Bioventing by Wind Force
Retec (2006) evaluated four different passive bioventing techniques: 1) barometric pumping, 2) barometric pumping with a check valve (baro-valve), 3) wind assisted air injection, and 4) wind assisted air extraction. Wind-assisted air injection was implemented through a funnel/vane wind collector (Figure III-1). The wind-assisted injection technique was the most effective of the four technologies and resulted in aeration of the vadose zone with oxygen concentrations > 5% at all soil gas probes. The average air injection rate was approximately 0.77 standard cubic feet per minute (scfm) with a maximum rate of 7 scfm. Retec (2006) concluded that wind-assisted bioventing is ideal for remote sites with average wind speeds > 15 mph.
Knafla and McIvor (2016) describe an innovative use of small agricultural windmills to inject air for bioventing remediation of a remote site impacted with diesel contamination. The site soils consisted of sandy clay, the primary zone of impact was between 7 and 14 m depth, and the depth to the water table was greater than 20 m. Five windmills delivered an average of 2.7 cfm air to each of 60 wells. Compared to energy provided by a diesel-powered generator for operation of pumps, wind power resulted in a reduction of between 3.5 and 8.4 tonnes-CO2 per year.
Solar-Powered Bioventing
McAlexander et al. (2024) present results on a research study of solar-powered bioventing at the Guadalope site in California, USA. Seven 400-W solar panels yielded air injection flow rates of approximately 0.85 m3/min (30 cfm). Estimates of natural source-zone depletion (NSZD) and source-zone depletion (SZD) rates of petroleum hydrocarbons were made from CO2 efflux and temperature measurements prior to and during bioventing. The bioventing yielded a SZD rate that was approximately 10 kg/day above the baseline NSZD mass removal rate and an increase in maximum soil temperature of 2.7oC compared to pre-bioventing temperatures.
Appendix IV - Optimization of Bioventing Systems
- Adding injection wells with screens that target remaining areas of higher TPH mass including lower permeability soil zones.
- Reduction of total air flow rate to balance biodegradation rates and oxygen consumption to achieve lower operational costs.
- Pulsed operation of the bioventing system operation such that the same biodegradation rate is achieved at lower operational cost.
- The addition of heat to the subsurface through solarization, hot-water, or hot-air to increase soil temperatures and biodegradation rates. Typically, low temperature soil heating is employed to stay within the range of temperatures optimal to indigenous mesophilic bacteria (up to 45oC; Aislabie and Foght 2008). Lower cost passive or active approaches to increasing soil temperature may be considered including use of solar energy. There are few theoretical or case study evaluations of low temperature heating, although there is recent literature on warm air injection for soil heating for borehole thermal energy storage (BTES) projects that potentially provides useful information (Moradi et al. 2016; Baser et al. 2019).
- Controlling or enhancing air flow to desired regions by pneumatic or hydraulic fracturing, or by sealing the ground surface to prevent “short-circuiting” (with for example asphalt pavement).
- Addition of dissolved or gaseous nutrients in the vadose zone through trenches or injection wells to support microbial growth and metabolic activity. Possible dissolved forms of nitrogen include ammonium or nitrate (note intent here is to support growth and not to supply a metabolic product). While gaseous anhydrous ammonia has been identified as a potentially advantageous form of nutrient because it can be added to air being injected, extreme caution must be taken because of safety hazards. Additionally, areas with concentrated nitrogen in soil may be detrimental to bacteria. Potential secondary effects of nutrient addition on groundwater quality must be well understood and monitored during implementation.
- Agarry and Latinwo (2015) conducted mesocosm tests comparing diesel removal rates in soil where a combination of bioventing with an amendment consisting of brewery wastes resulted in 92% removal of diesel, compared to bioventing only that resulted in 62% removal.
- Shewfelt et al. (2005) conducted laboratory respiration tests and concluded the optimum nitrogen for enhanced biodegradation for soil tested was a carbon:nitrogen (C:N) ratio of 10:1 (with NH4Cl as nitrogen source)4, giving a degradation rate of 150 mg kg-1 day-1, which was about 3X higher than a non-amended test with lower N content. The optimum soil-water content was 18 wt.%, which corresponded to approximately 50% of the field capacity of the soil.
- Davis et al. (1998) conducted bioventing field trials where degradation rates calculated from oxygen respiration rate coefficients ranged up to 69 mg kg-1 day-1. For nutrient‐amended areas within the field trial plot, the estimates of amended NAPL degradation rates were 2X to 3X higher than estimates from nonamended areas.
Appendix V - Process-based Soil Gas Model
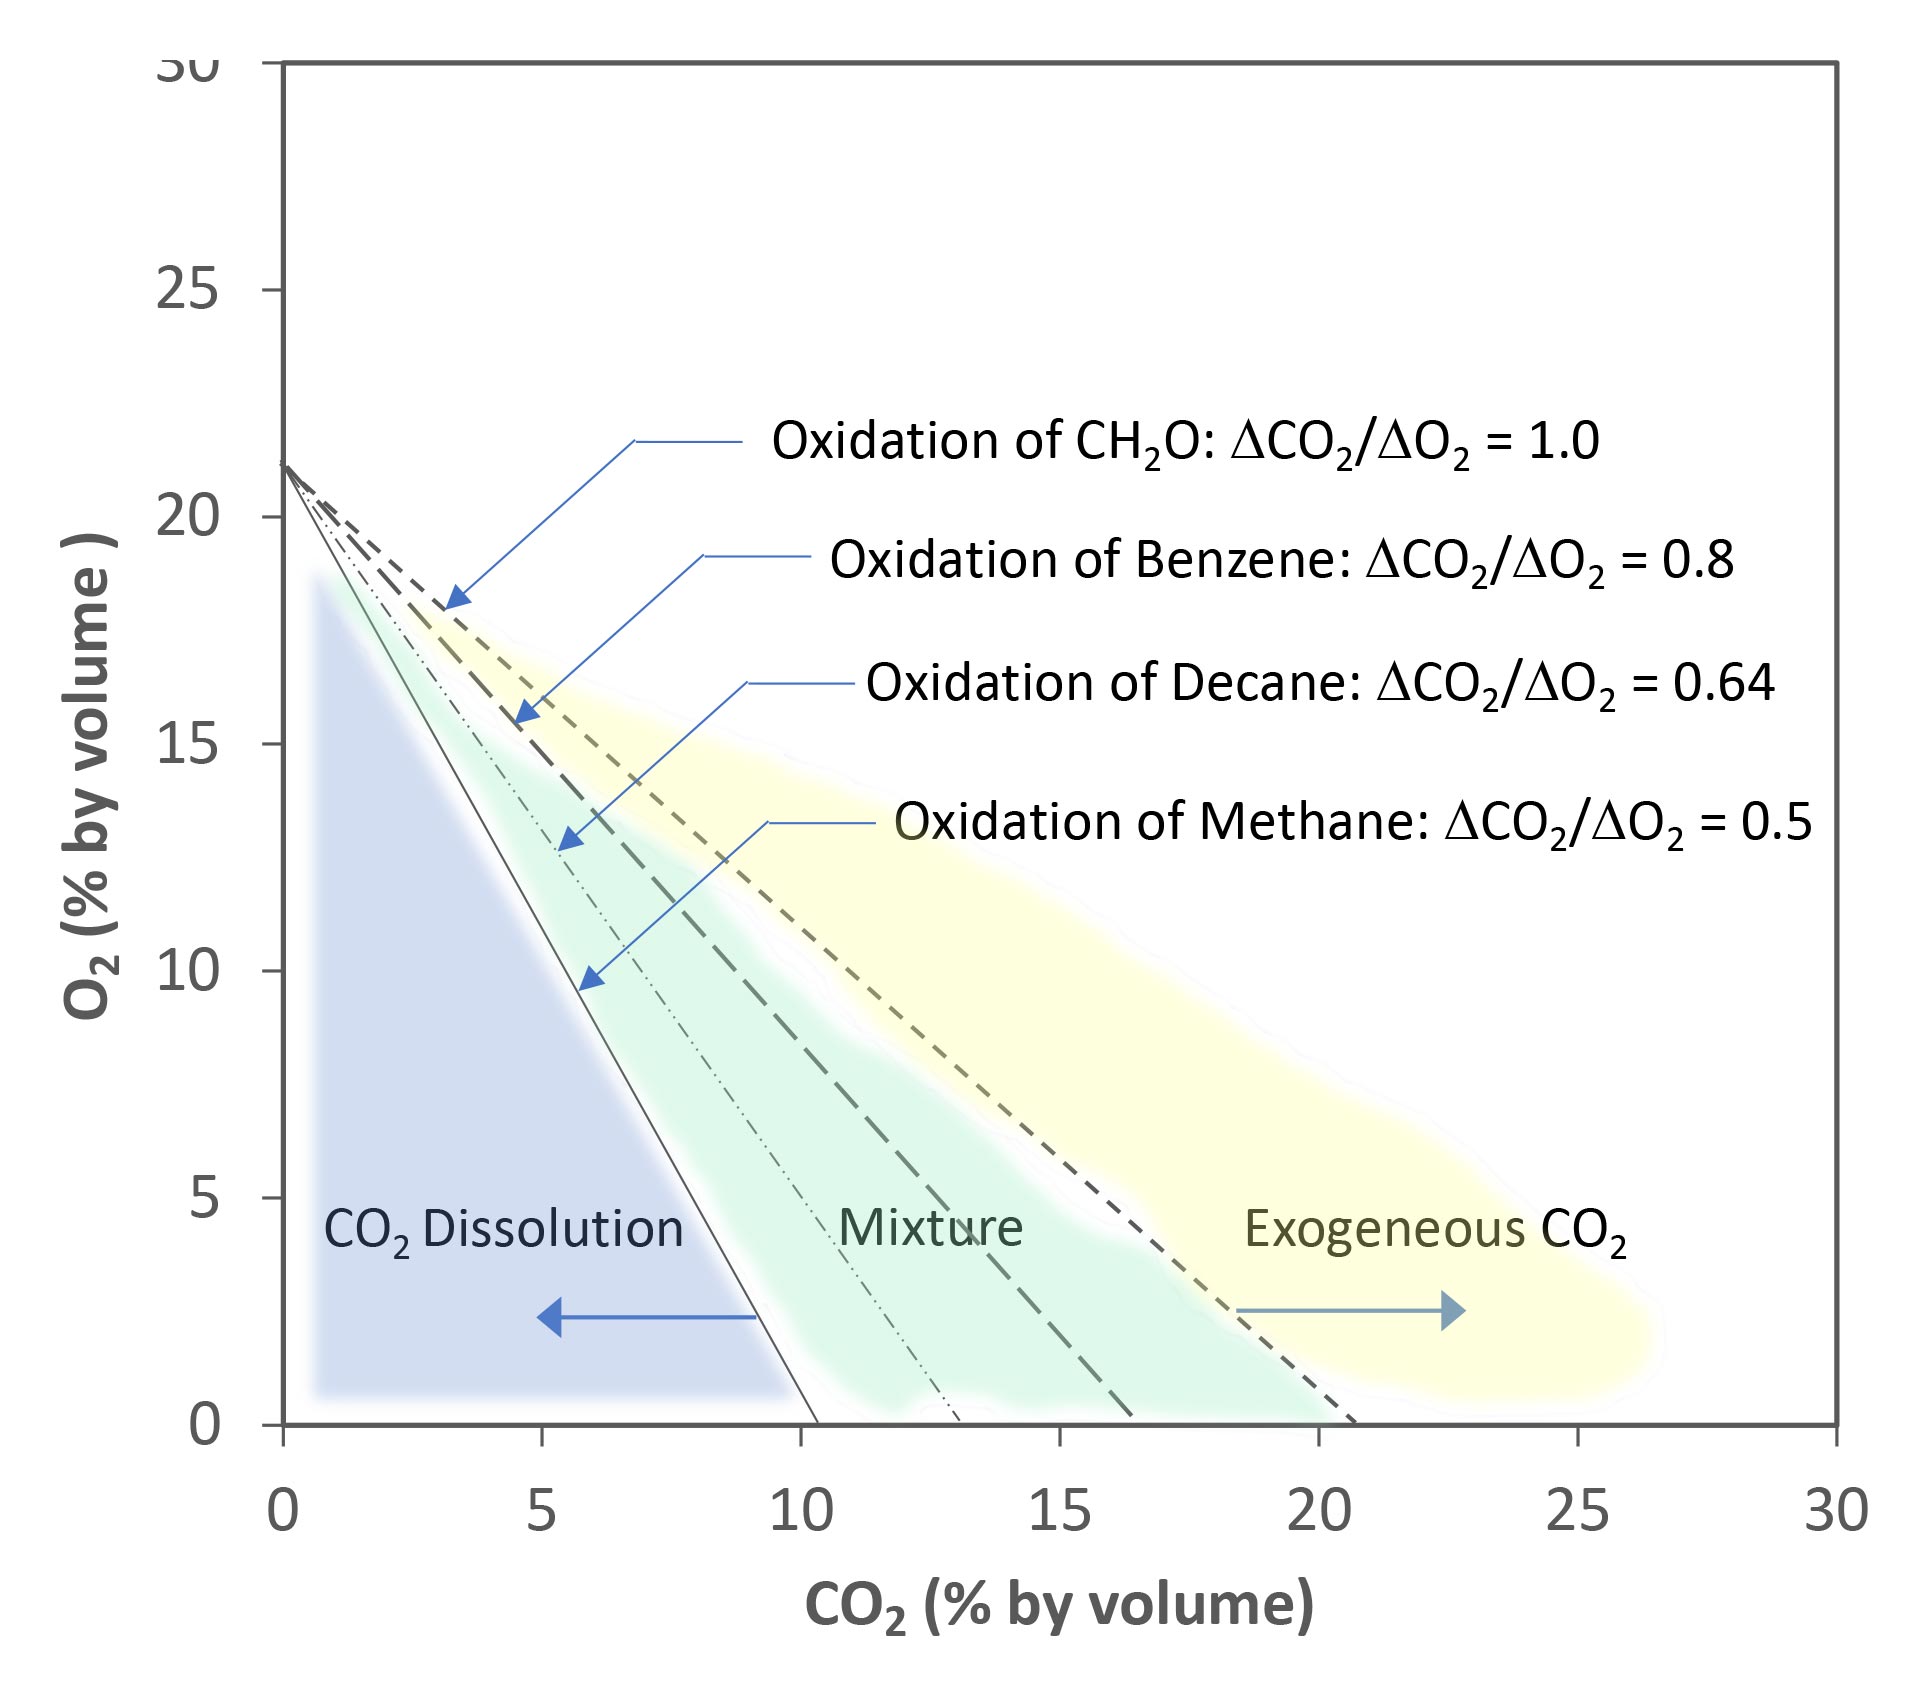
The process-based model has been applied in baseline monitoring of carbon sequestration projects as a method of detecting CO2 leakage but has not to our knowledge been demonstrated in published studies of bioventing evaluations. The data analysis is however simple and plots of CO2 versus O2 and CO2/O2 versus CH4 may be evaluated to assess dominant processes. A CO2 / O2 ratio that is close to 0.5 may indicate primarily methane gas oxidation and limited oxidation of soil PHCs, and thus may be a threshold indicator of limited additional benefit with respect to unsaturated zone biodegradation, if methane is from deeper anaerobic zones. Case studies of this emerging method of analysis are needed.