Appendix I – SVE Technology Description
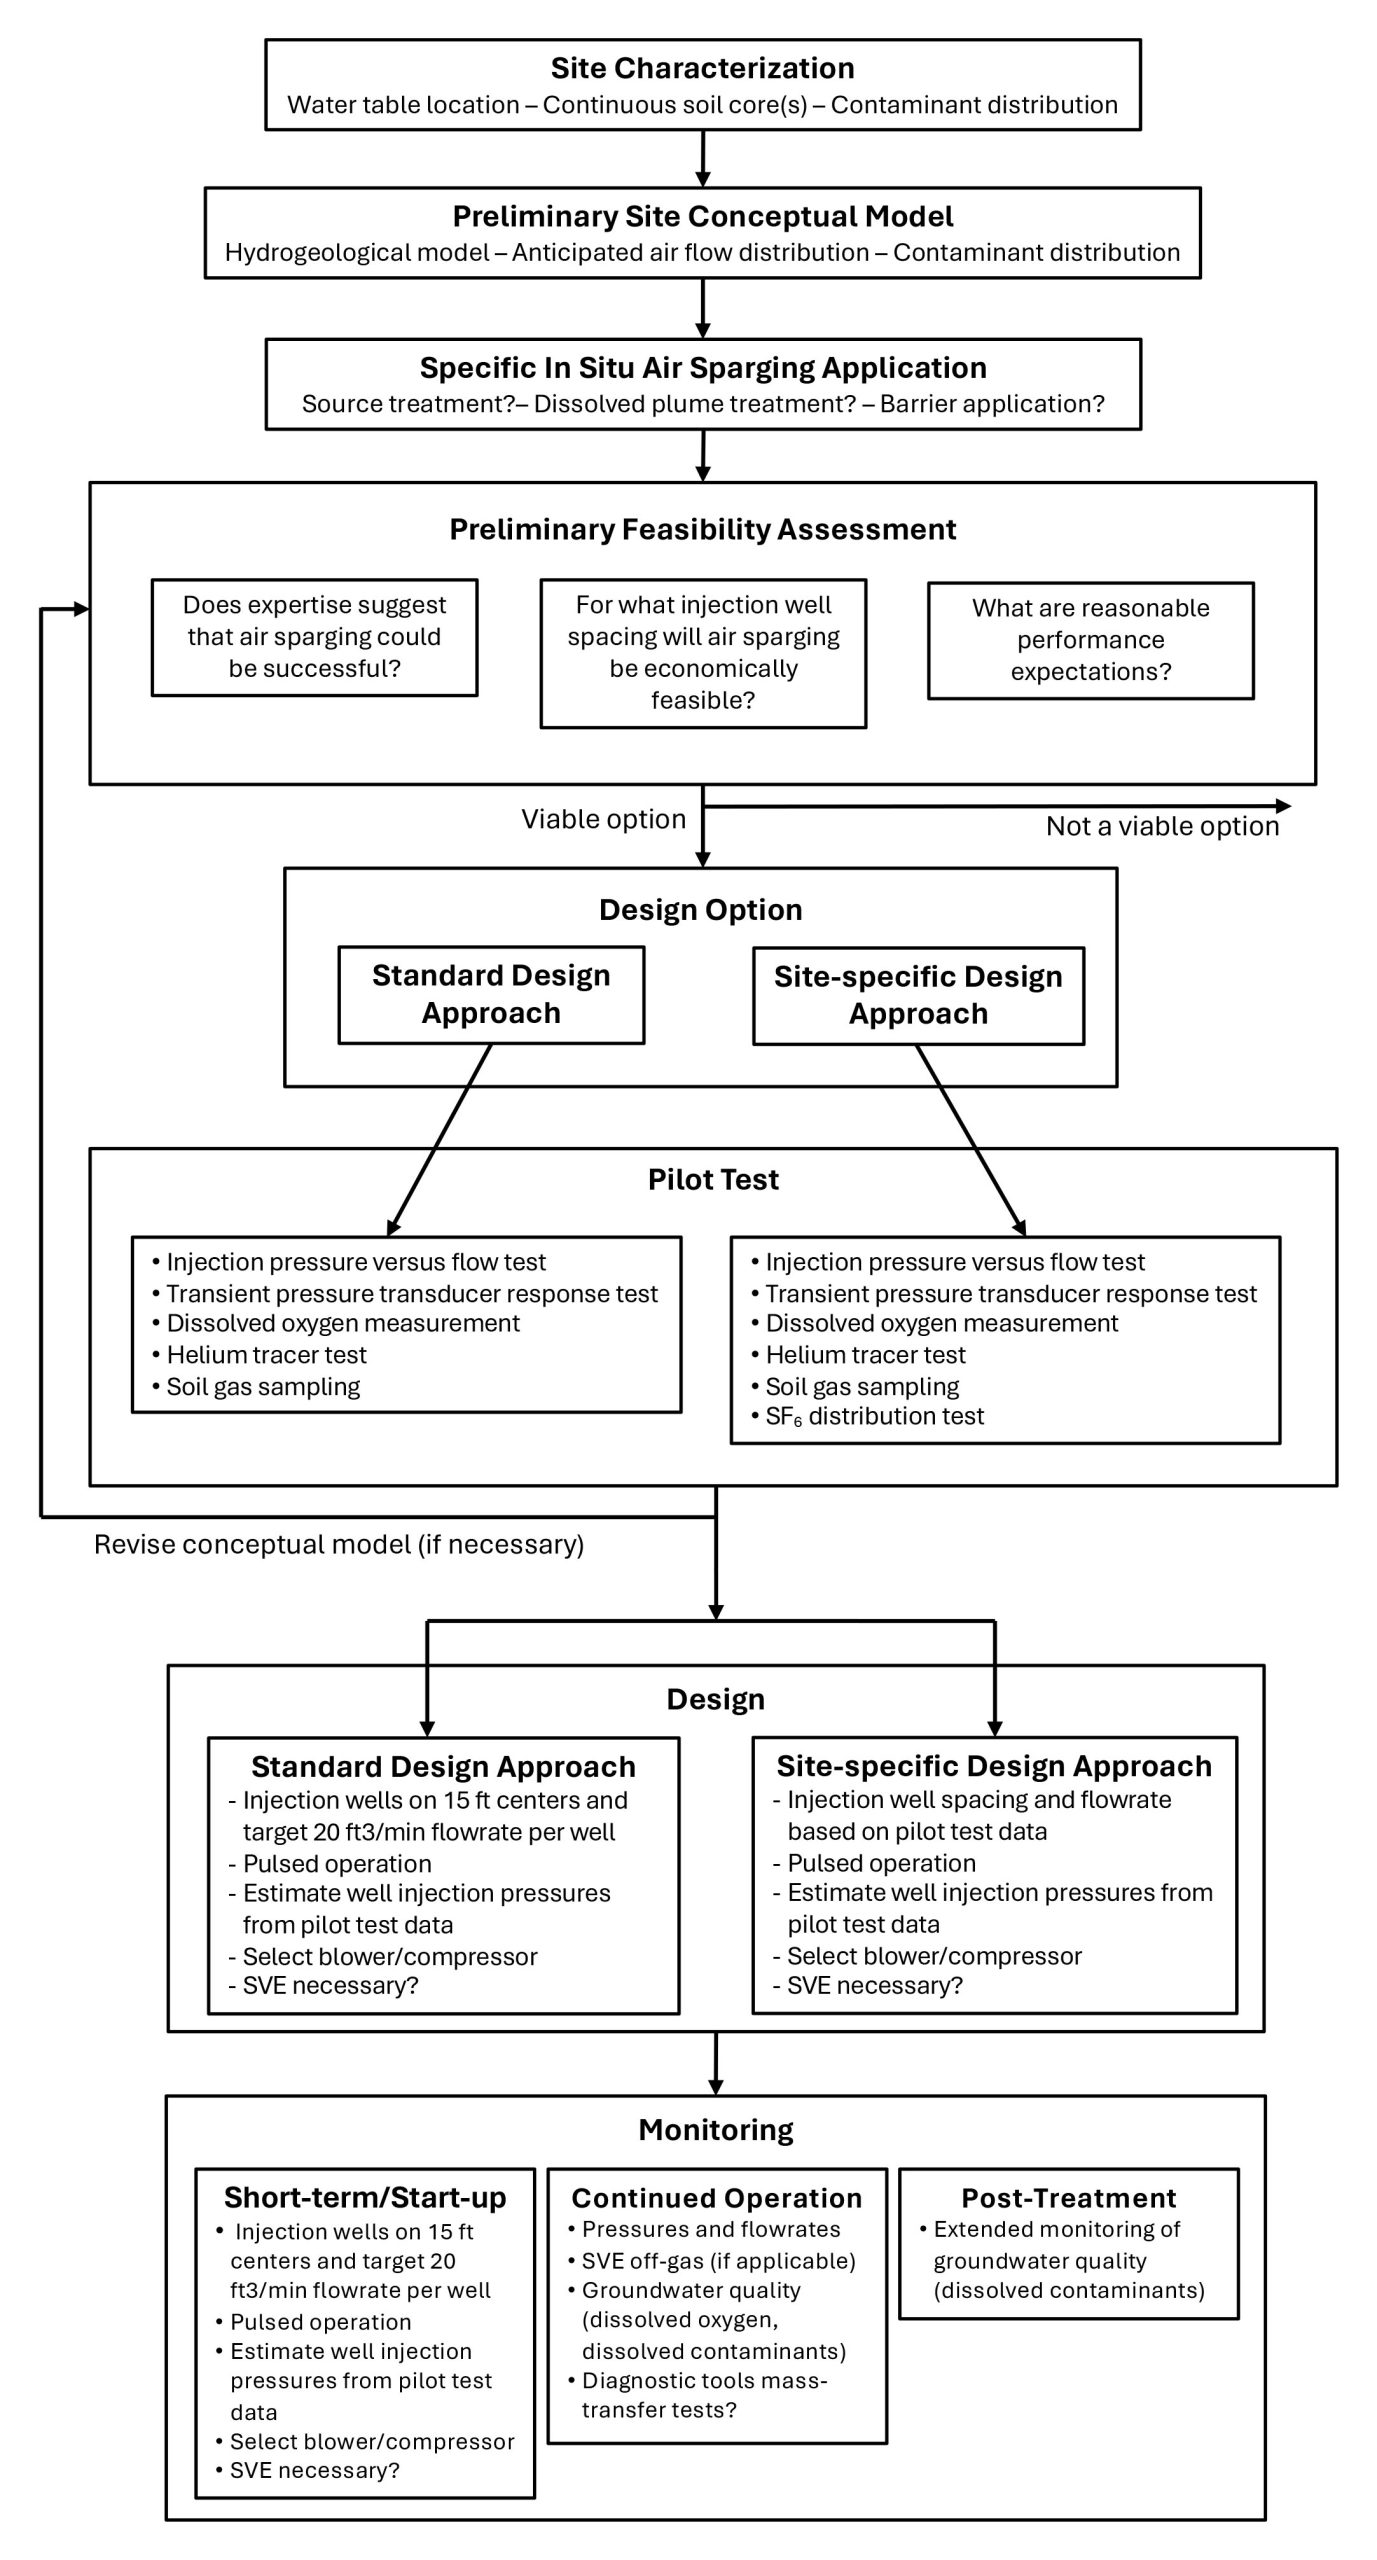
ESTCP (2002) Air Sparging Design Paradigm
- Site characterization and development of site conceptual model
- Preliminary feasibility assessment
- Pilot testing
- Design
- Monitoring
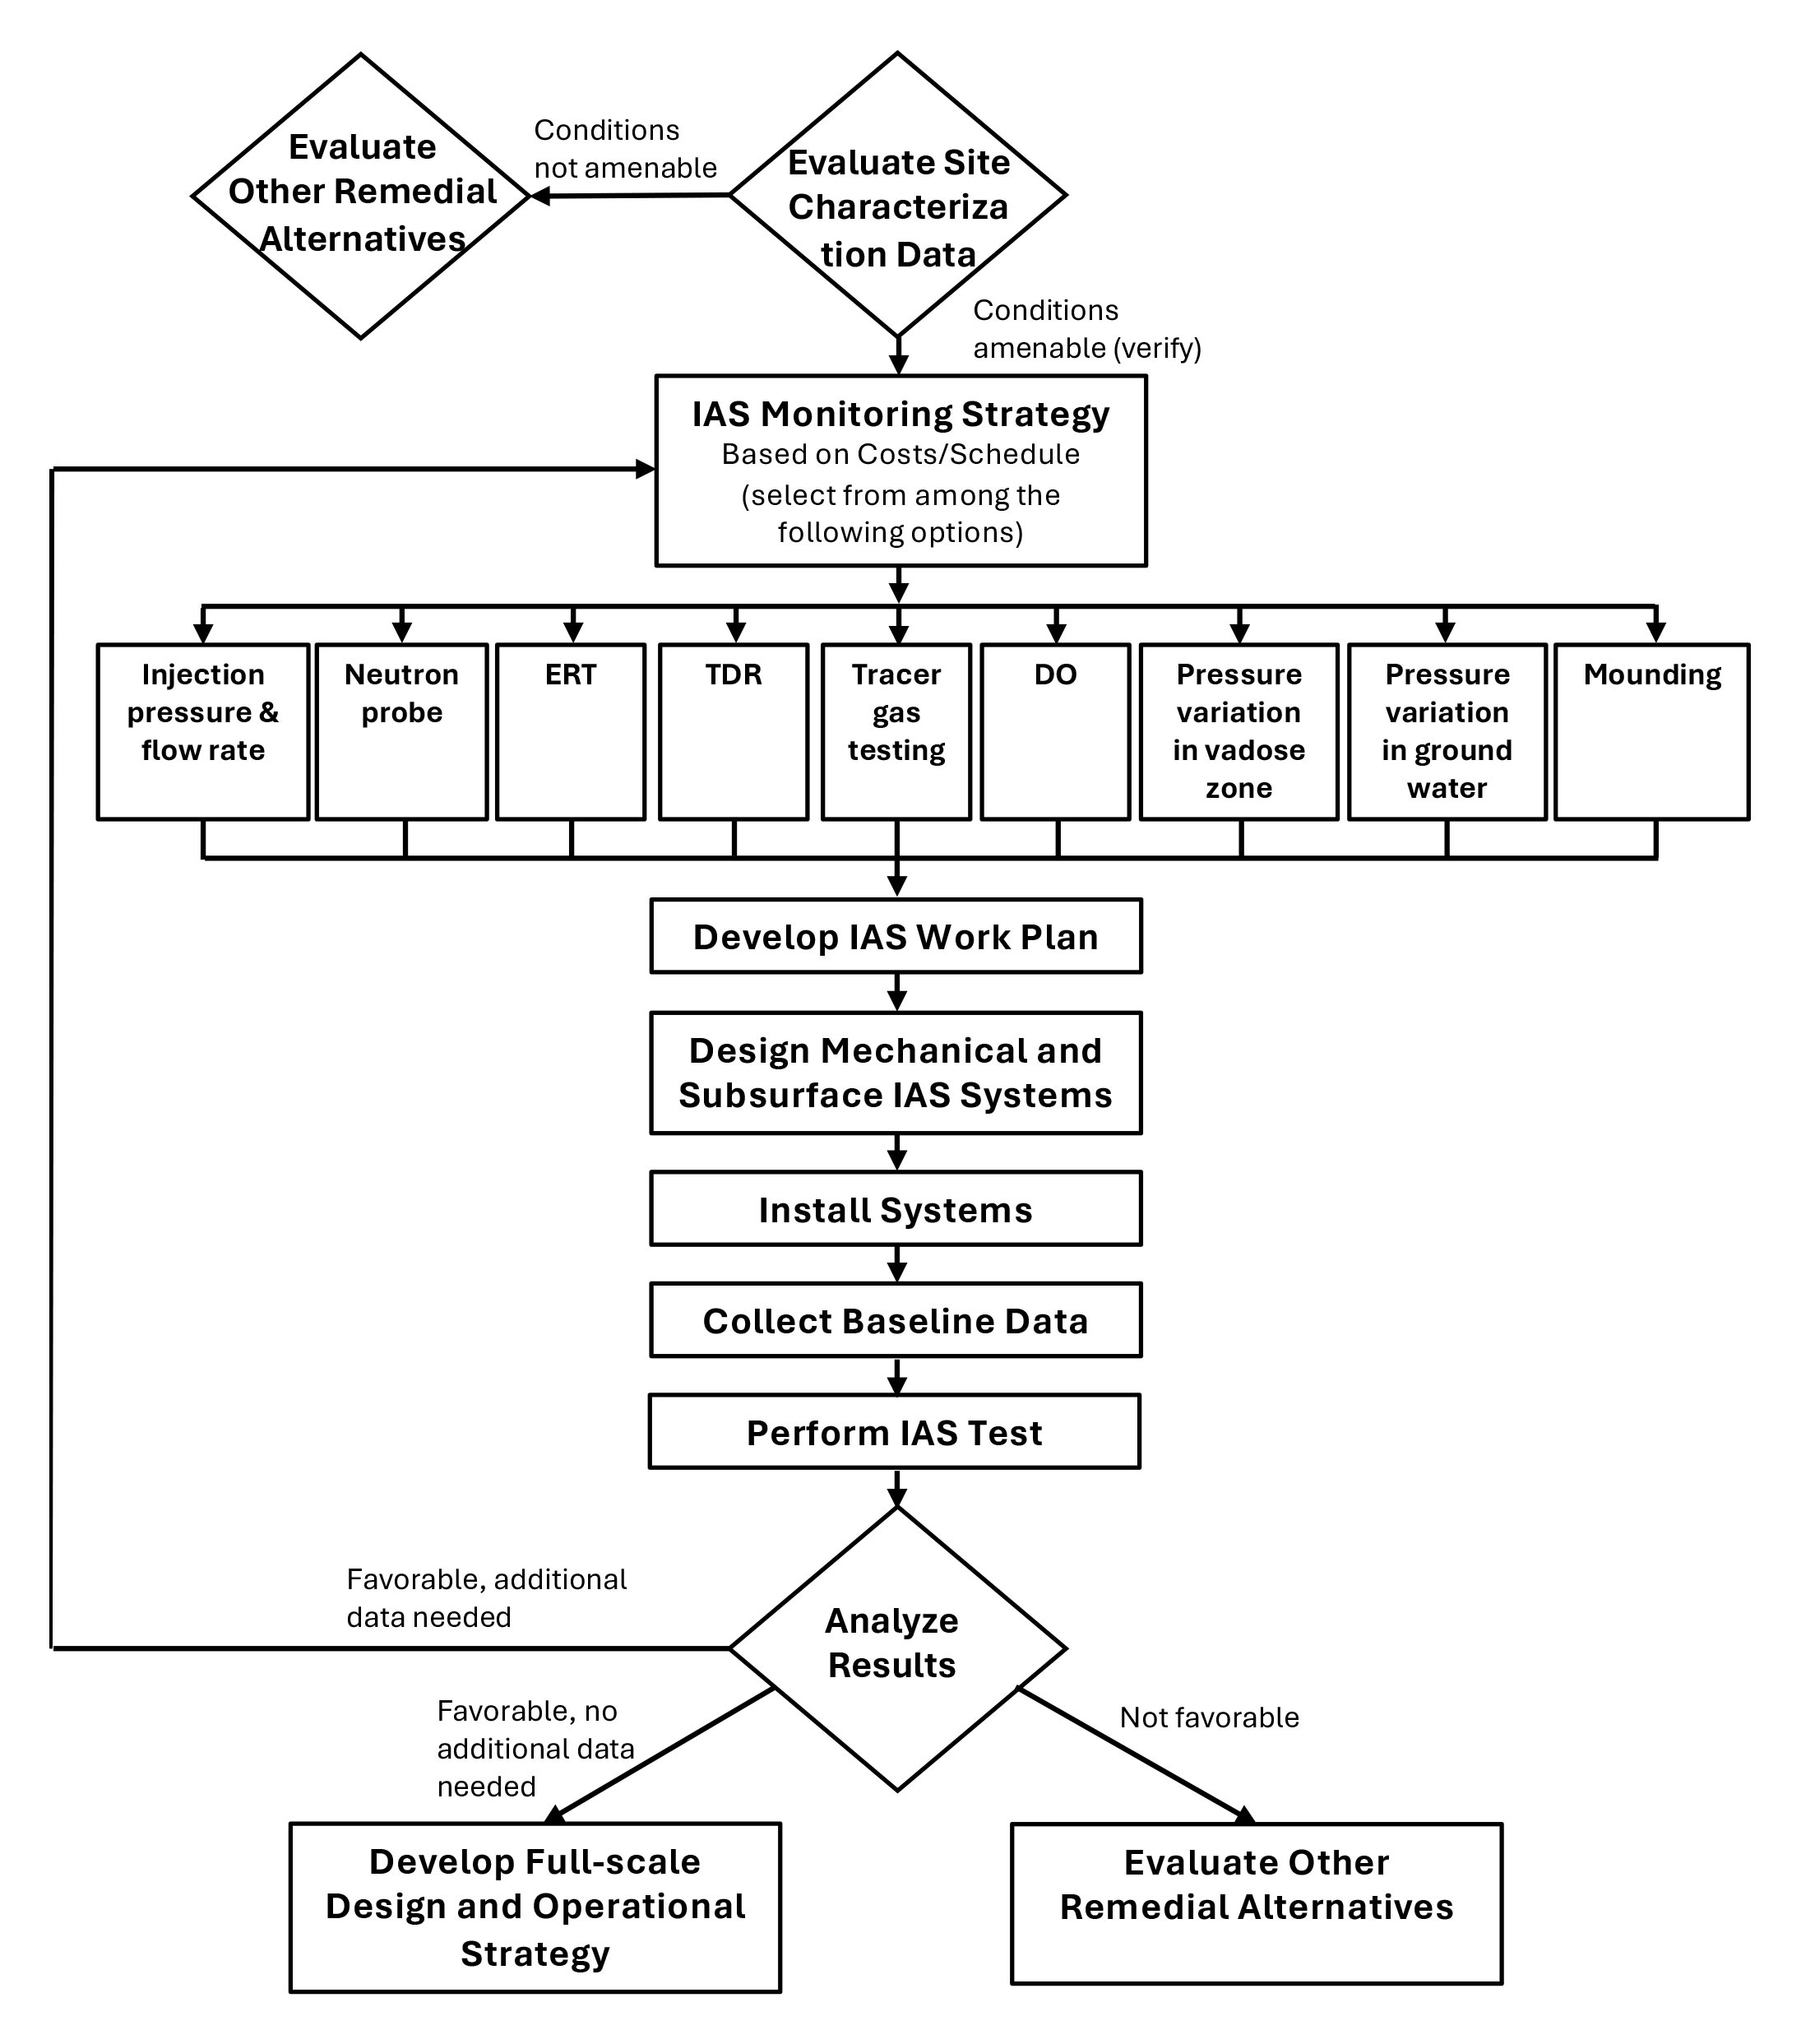
The pilot testing is divided into two approaches, 1) standard design approach and 2) site-specific design approach. For each of these two approaches there are default designs and recommended monitoring. The flow chart for air sparging design including pilot testing is shown in Figure B-1.
The standard design approach recommends the following data collection: injection pressure versus flow rate test, transient pressure response test, dissolved oxygen measurements, helium tracer test and soil gas sampling. Based on this data set, injection wells based on 15 ft centers and 20 ft3/min injection rate are recommended. The site-specific design approach recommends the standard methods plus sulphur hexafluoride tracer test to assess air distribution more accurately.
Overview of Technology
The phase change and mass removal typically decrease during the treatment life cycle. During early stages of remediation, the primary mass removal is from air pathways of low resistance (higher permeability soils), where chemicals in adsorbed phase or non-aqueous phase liquids (NAPL) partition into the moving air. Contaminants in lower permeability soils will not be removed by advection because soil vapors will preferentially flow through higher permeability soils. When the mass in higher permeability soils becomes mostly depleted, the rate of mass removal may approach a low value or cumulative mass recovery may approach an asymptotic value. This is because contaminants in lower permeability silts and clays and within the capillary fringe, if present, must desorb and diffuse into an advective flow path before they can be removed by the SVE system. If the rate of diffusion is slow, the time duration for removing VOCs may be significantly extended (US EPA 1991). US EPA (2018) describes a two-compartment model (coarse- and fine-grained) for prediction of concentrations and clean-up times when there are mass transfer limitations resulting from slow diffusive transport in fine-grained soil layers.
The addition of air through SVE may result in enhanced aerobic biodegradation and consequently SVE is closely related to bioventing (refer to Bioventing Factsheet). Because there is often contamination at or below the water table, remediation through air sparging will often be an additional component to the SVE system.
Exit Strategy Toolkit
Air Sparging Factsheet
a) optimize AS remediation performance, and
b) transition from AS to natural attenuation, passive remediation, or “no further action”.
This factsheet addresses both air sparging and bio sparging (enhanced bioremediation). For simplicity, these technologies are collectively referred to as AS in this factsheet. This factsheet should be read in conjunction with the other air-based remediation factsheets on soil vapor extraction (SVE) (see Soil Vapor Extraction Factsheet) and bioventing (see Bioventing Factsheet), because of the common use of AS with SVE and similarities in application. In addition, this factsheet should be read with the overarching Compendium Factsheet, which provides a broader context for the application of AS within a framework for remedial decision making. This factsheet is not intended to provide detailed guidance on AS and assumes that a sufficiently detailed conceptual site model (CSM) has been developed and AS has been selected as an appropriate technology to meet agreed remedial concerns and objectives. The scope of this factsheet is primarily injection of air to treat petroleum hydrocarbon (PHC) contamination.
Details of the AS technology and its application are contained in the appendices. Appendix I provides a summary of the AS technology. Appendix II provides guidance on pilot testing. Appendix III provides methods to optimize AS implementation. Additional details on AS design and implementation are also found in Johnson et al. (1993), Hinchee (1994), NAVFAC (2001), ESTCP (2002), US ACE (2013) and CRC Care (2018b). The information found in the appendices and reference materials can be extremely helpful in supporting remedy implementation and facilitating the uptake of risk-based approaches. Note that there are analogous technologies to AS that supply amendments to the subsurface to enhance in-situ remediation such as oxygen-release compounds or chemical oxidants. These technologies are beyond the scope of this factsheet but may warrant consideration.
AS - Technology Summary
AS may be configured to treat PHC sources and/or associated groundwater plumes. AS design should be based on remedial goals and site-specific conditions which affect the PHC source distribution in the subsurface. The AS design should be based on maximizing the mass transfer of O2 to the subsurface, which depends largely on injection flow rate, system operation (e.g., pulsed versus continuous), and the hydrogeology (heterogeneity) of the formation. Additional information on AS technology is provided in Appendix I.
Remedial Concerns and Objectives
Generally, volatilization is the primary PHC attenuation mechanism at early stages of AS implementation when volatile COCs present in LNAPL, aqueous, or sorbed phases are in direct contact with air channels. As AS continues, volatilization expressed by the mass partitioning of COCs to the gaseous phase becomes more rate limited and concentrations of the more volatile COCs decrease. Meantime, the microbial community within the area of AS influence becomes more established because of the added presence of an electron acceptor (O2) and biodegradation becomes the primary PHC attenuation mechanism. Biodegradation may also be the more dominant mass removal process in aquifers at lower dissolved PHC concentrations less than about 1 mg/L (Johnson 1998). Diagnostic tools (see call-out box) are an additional line of evidence that can help distinguish the dominant PHC attenuation mechanism and inform the selection of performance metrics and transition thresholds.
Performance Metrics
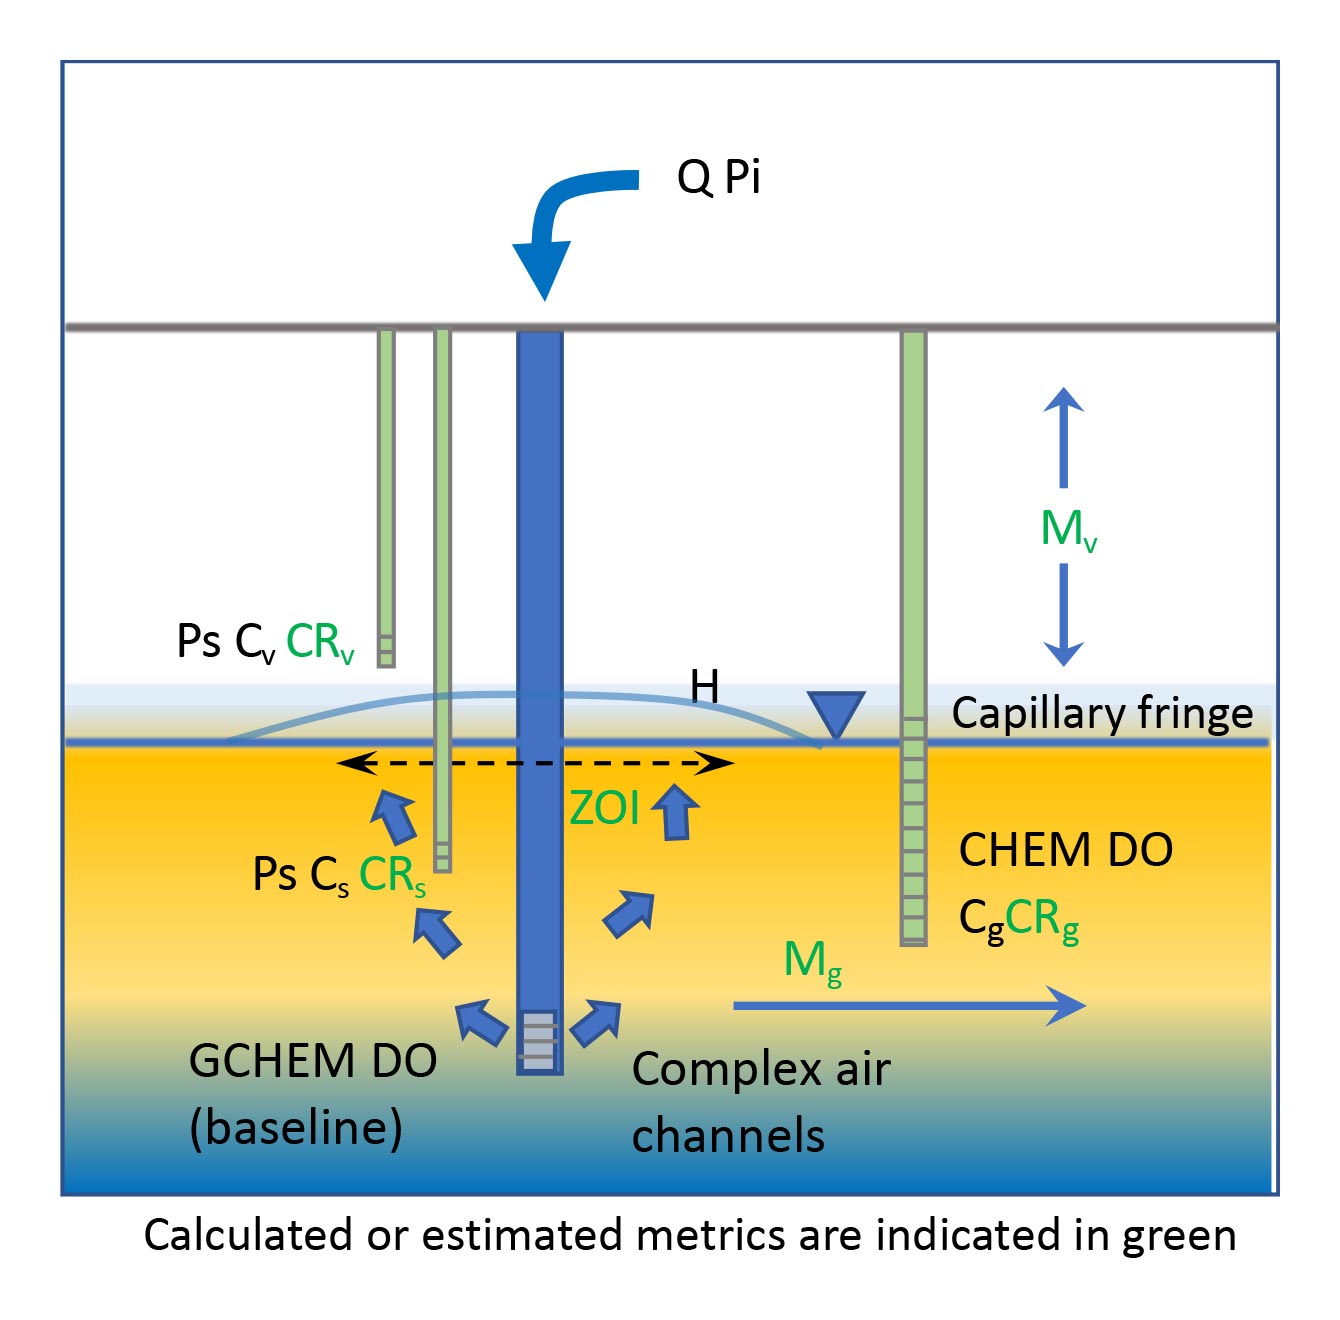
Performance Metrics
- Cs = Soil concentration
- Cg = Groundwater concentration
- Cv = Soil vapor concentration
- CRs CRv CRg = Concentration ratios
- Mg = Groundwater mass flux or discharge
- Mv = Soil vapor mass flux or discharge
System:
- Q = Injection flow rate
- Pi = Injection pressure
- Ps = Pressure in soil
- DO = Dissolved oxygen
- H = Water level mounding and bubbles
- GCHEM = Geochemistry data
- He / SF6 = tracers (optional)
- ZOI = Zone of influence
System Metrics
- Injection air pressures at individual injection wells and the system header
- Injection air flows at individual injection wells and the system header
- Pressures in unsaturated and saturated soil zone at monitoring points
- Dissolved oxygen concentrations at monitoring wells
- Water level mounding at injection wells and monitoring wells
- Geochemistry data at injection wells and monitoring wells
- Monitoring of air bubbles in wells and at surface
- Helium (He) tracer test (optional, may be conducted during pilot testing)1
- Sulphur hexafluoride (SF6) air distribution test (optional, may be conducted during pilot testing)
Diagnostic Tools
Pilot testing is a valuable step to identify whether AS is potentially infeasible (e.g., because of confining layers that prevent air flow) and to provide data for design and optimization (Appendices II and III). Testing often includes the measurement of injection pressures and injection volumes versus flow rates at injection wells and pressures exhibited by water-table mounding and dissipation (if injection is pulsed) within the aquifer using pressure transducers installed in monitoring wells. Pulsed AS operation has significant potential to increase contaminant mass removal rates through improved air distribution as new air channels are formed during each pulse and possible increased AS zone of influence (Appendix III). Helium tracer testing (see call-out box) and sulphur hexafluoride (SF6) tracer testing of air distribution may also be conducted during pilot testing to assess ROI.
Subsurface Metrics
- Concentrations in soil, groundwater, and soil vapor (Table 1)
- Mass flux or discharge in groundwater and/or soil vapor
Evaluation of Air Sparging Performance
- time to achieve objectives
- cost (e.g., $/kg HC removed or treated)
- greenhouse gas emissions (GHG) or other quantifiable sustainability metrics (e.g., kg CO2 emissions/kg HC removed or treated)
Transition Thresholds
Transition thresholds are comprised of remedial objectives and relevant performance metrics. The transition thresholds are used to support remedial decisions related to transitioning to another remedial technology or terminating operation of active remediation altogether. Like performance metrics, transition thresholds should be established and agreed with all relevant stakeholders prior to the onset of AS.
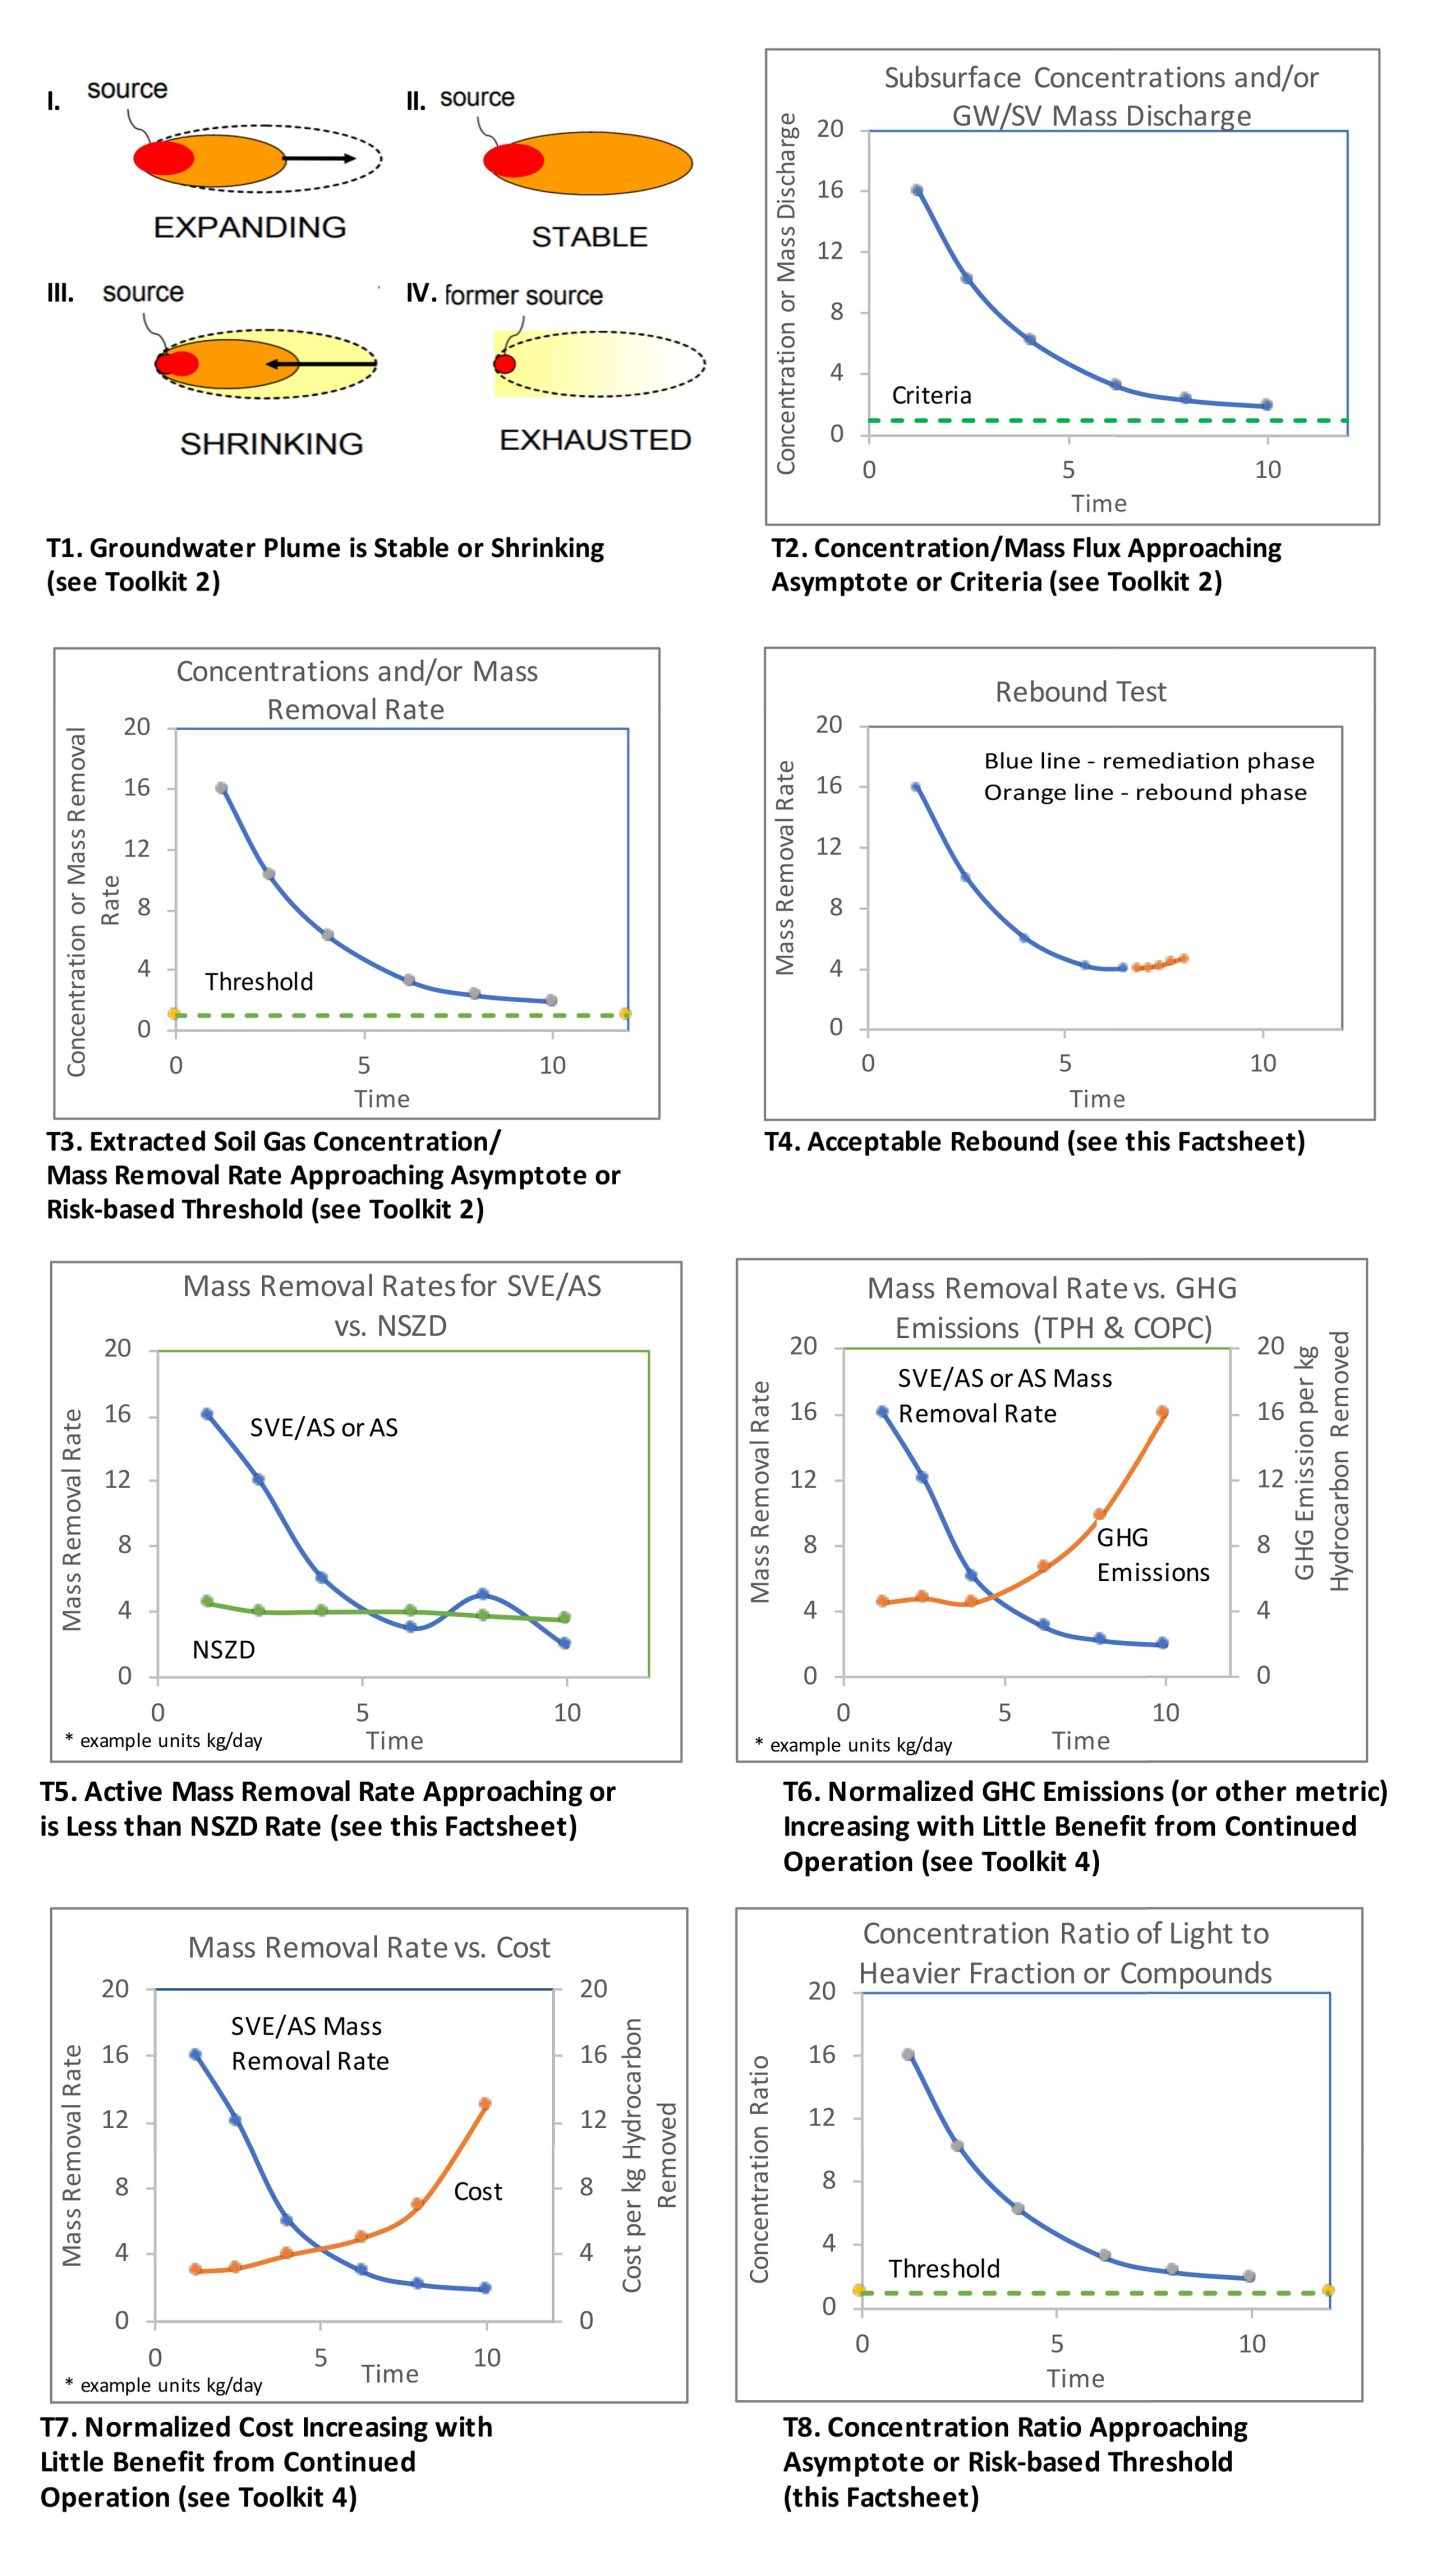
The decision to terminate AS requires confidence (multiple lines of evidence – MLE) that rates of PHC attenuation are sufficient to meet remedial goals after the system has been turned off. Eight transition thresholds (T1 to T8) are provided below and in Table 1 and Figure 2 which are similar to those in the SVE Factsheet, given that the remedies are air-based technologies and often implemented together:
T1. Stable or shrinking dissolved groundwater and soil vapor plumes.
T2. Subsurface concentrations and/or mass flux, mass discharge or mass loading less than or approaching defined risk-based or regulatory criteria (i.e., where MNA is expected to “finish the job”)2.
T3. System total mass removal and/or mass removal rates approaching asymptotic levels or risk-based thresholds indicating reducing efficacy of remediation.
T4. Minimal or acceptable rebound (i.e., stability) in groundwater or vapor concentrations based on quantitative analysis of plume concentrations, mass discharge or mass loading.
T5. Mass removal rates similar to natural attenuation or NSZD rates obtained from the baseline assessment3 for either total hydrocarbon or individual COCs. The mass removal rates can be compared based on an area normalized rate in units of mass per time-area or for a representative LNAPL-impacted area or “site” in units of mass per time.
T6. Decreasing mass removal rates and corresponding GHG emissions (or other quantifiable sustainability indicators) per mass of contaminant removed that are increasing exponentially.
T7. Decreasing mass removal rates and corresponding costs per mass of contaminant removed that are increasing exponentially.
T8. Preferential loss of lighter molecular weight hydrocarbons (e.g., risk-drivers such as benzene) from groundwater or LNAPL and/or ratios of light to heavy molecular weight hydrocarbons that have reached asymptotic levels and/or risk-based thresholds.4
Transition Threshold T3 can be measured from SVE monitoring data, assuming SVE is also applied. The contribution of mass recovery from AS compared to SVE can also be quantified by using helium as a tracer. A given mass of helium is placed into the injected air and then measured in the SVE exhaust with and without the AS system on (Johnston et al. 2002).
Tracer Tests
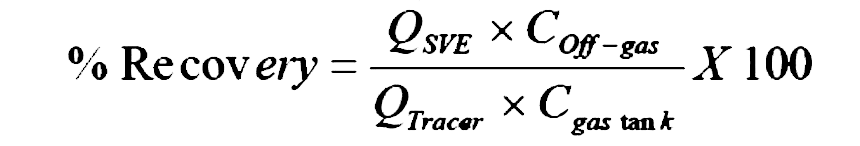
where QSVE is the SVE flow rate; Coff-gas is the He concentration in the SVE off-gas; Qtracer is the flow rate of the injected He; and Cgas tank is the initial concentration of the He injected. ESTCP (2002) also provides a simplified recovery calculation based on concentrations where any % Recovery > 80% is considered good recovery and any % Recovery < 30% indicates the likely presence of a hydrostratigraphic barrier preventing upward migration of air. % Recovery values in-between 30 and 80% indicate fair performance. The use of tracers in AS and SVE applications may become more limited with increasing scarcity of tracers such as He and concerns with GHG emissions.
| Metric | Locations/Frequency | |
|---|---|---|
| Performance Metrics | ||
| System | ||
| P1. Injection air pressures at injection wells and system header | ||
| P2. Injection air flows at injection wells and system header | ||
| P3. Pressures in unsaturated and saturated zones at monitoring points | ||
| P4. Dissolved oxygen concentrations at monitoring wells | ||
| P5. Water level mounding | ||
| P6. Geochemistry data | ||
| P7. Monitoring of air bubbles | ||
| P7. Helium tracer test (optional) | ||
| P9. Sulphur hexafluoride air distribution test (optional) | ||
| Subsurface | ||
| P10. Soil, groundwater, and soil gas concentrations* at monitoring locations | ||
| P11. Groundwater and soil vapor mass flux and mass discharge | ||
| Transition Thresholds | ||
| T1. Stable or shrinking groundwater and soil vapor plumes (consider statistical tools such as Mann-Kendall, regression and spaciotemporal plume or mass analytics) | ||
| T2. Subsurface concentrations and mass flux, discharge or loading are at or approaching criteria | ||
| T3. System mass removal rates approaching asymptotic level | ||
| T4. Minimal or acceptable rebound | ||
| T5. Mass removal rates during AS operation approaching natural attenuation (i.e., NSZD) rates | ||
| T6. Decreasing mass removal rates while normalized GHG emissions are increasing | ||
| T7. Decreasing mass removal rates while normalized costs are increasing | ||
| T8. Compositional change indicating decreasing light fraction as indicated by concentration ratios | ||
Table 1 - Summary of Example Performance Metrics and Transition Thresholds Checklist (select applicable metrics and thresholds as needed)
Air sparging may, in some cases, be conducted in absence of SVE, for example, when the water table is relatively shallow (because to the vadose zone is not sufficiently thick to capture vapors with SVE) and if there are no health and safety concerns related to vapor migration (e.g., no buildings or enclosed spaces present). Without the SVE system monitoring data, AS mass removal (Threshold T3) is challenging to measure, which consequently has implications for Thresholds T5 to T7. The use of surface efflux measurements of PHCs and CO2 may be used to characterize hydrocarbon depletion.
A full accounting of the biodegradation mass loss associated with AS requires consideration of how the technology affects processes in both the unsaturated and saturated zones. Historical research on AS (Appendices I and II) has focused on estimation of biodegradation mass loss in the saturated zone. Mass transfer of VOCs and unconsumed oxygen to the unsaturated zone and subsequent biodegradation is potentially unaccounted for unless respiration type tests are performed (see Bioventing Factsheet). Depending on whether AS is paired with SVE, there are options for characterizing biodegradation rates. If there is no SVE system, efflux can be monitored at ground surface. While no literature could be found on specific application of efflux for AS monitoring, there are extensive literature and guidance available on NSZD (e.g., Garg et al. 2017; API 2017, see the Natural Attenuation Factsheet). If SVE is occurring, the CO2 flux from aerobic biodegradation can be quantified through radiocarbon monitoring of SVE exhaust (see the Bioventing Factsheet).
Validation
Groundwater quality monitoring data obtained from conventional monitoring wells may be compromised by AS operation (due to localized aeration) and a slow rise in hydrocarbon constituent concentrations may occur over periods of 1 to 12 months after cessation of the AS system (Johnson 1998). The criteria for rebound in Bass et al. (2000) is recommended to guide interpretation of data:

Bass et al. (2000) found that rebound was particularly prevalent at PHC sites where there was a LNAPL smear zone and seasonal water table fluctuations that exposed the groundwater to new sources of contamination. NAVFAC (2001) recommend turning off the AS system for 12 to 18 months while monitoring for rebound. While the timeframe for rebound assessment is site-specific, these guidance and factors should be considered in the monitoring design. Again, the process for system shutdown and rebound monitoring should be agreed upfront with all key stakeholders before the AS system is first turned on and at a minimum prior to turning the system off (i.e., as transition thresholds are becoming imminent).
Appendix I – AS Technology Description
Overview of Technology
Three main factors affecting air sparging performance are (ESTCP 2002):
- The air distribution in the target treatment zone.
- The distribution (location and concentration) of contaminants relative to the air distribution.
- The contaminant characteristics (composition and chemical properties).
AS Air Distribution
Overview of Historical AS Research
The physical processes of groundwater upwelling are also important to understand. When air is injected in a well, air displaces the water within the aquifer near the well screen as air channels are formed. The water is then displaced upwards and laterally away from the zone surrounding the well screen. Once the air channels are formed and stable, the water table then returns to near static levels. After air injection ceases, the water flows back into the voids with higher air content as the remaining air rises to the water table (NAVFAC 2001; US ACE 2013).
The physical configuration of air channels has a significant effect on contaminant mass transfer. The reason for this is because for volatilization to occur, VOCs must migrate primarily by molecular diffusion in water to the nearest air channel (NAVFAC 2001; ESTCP 2002). As the air channels are small, and the distance between air channels can vary from centimeters to meters, the mass transfer rates will also consequently vary.
Research on AS Air-Channelling
The research by Clayton (1998) indicates that, at both the field and laboratory scale, coarse sands are more prone to air channeling and bypassing than fine sands. Additionally, the larger air gradients and capillary pressures in fine sands result in a less buoyancy-dominated flow pattern, with a larger lateral extent of air flow. Mortensen et al. (2000) in a study of sparging at a MTBE site reported similar results to Clayton (1998) and additionally determined from comparison of modeling to laboratory studies that kinetic mass transfer limitations may control the volatilization and treatment rate. This research indicates the universality of widely spaced air channels in homogeneous media is not supported by available evidence and that the air distribution is highly dependent on the site geology.
Effects of Macro-scale Geology
Gas Ebullition in Sediments
AS Implementation
The zone of influence of air sparging and well spacing is an important consideration in AS design. US ACE (2013) recommends that injection well spacing be designed to meet a minimum bulk air content of 3% in the target saturated zone. While geophysical methods and tracers can be used to measure air content, these methods may not be practical at some sites. Monitoring of water levels, dissolved oxygen and air pressures can also be used to provide insight on the approximate zone of influence but limitations in these data and potential to overestimate the zone of influence should be understood (ESTCP 2002; US ACE 2013). The effect of soil heterogeneity on air distribution should also be understood.
Biosparging Considerations
Appendix II – Pilot Testing and Monitoring
Guidance on pilot testing and monitoring of AS is provided in NAVFAC (2001), ESTCP (2002), USACE (2013), Shell (2007) and CRC Care (2018b). The summaries of these guidance documents are intended to provide practitioners with an overview of decision frameworks and data collection activities for both air sparging and bio sparging. Because of the technical nature of air sparging design, it is recommended that the practices in these documents be well understood. The differing remedial goals and objectives that may be achieved between air sparging and bio sparging systems should be recognized, and the practically of AS remediation depending on the goals / objectives and site size should be recognized. Depending on the site, the remediation may focus on air sparging or bio sparging, or a combination or treatment train approach involving both technologies.
NAVFAC (2001) Air Sparging Guidance Document
ESTCP (2002) Air Sparging Design Paradigm
- Site characterization and development of site conceptual model
- Preliminary feasibility assessment
- Pilot testing
- Design
- Monitoring
The standard design approach recommends the following data collection: injection pressure versus flow rate test, transient pressure response test, dissolved oxygen measurements, helium tracer test and soil gas sampling. Based on this data set, injection wells based on 15 ft centers and 20 ft3/min injection rate are recommended. The site-specific design approach recommends the standard methods plus sulphur hexafluoride tracer test to assess air distribution more accurately.
US ACE (2013) In-situ Air Sparging
- Interpretation of water table mounding and pressure data including avoiding overestimation of zone of influence from these data
- Pressure versus injection response including air entry pressure to evaluate aquifer characteristics for air sparging
- Interpretation of dissolved oxygen data including issues with in-well aeration
- Conduct of tracer tests including use of helium and sulphur hexafluoride
- Short term versus long-term pilot testing
Shell (2007) Protocol for Oxygen Pulse Injection System (OPIS)
Before applying OPIS, the following site characterization data are necessary:
- Closure goals
- Depth to water (ft bgs)
- Historic water table fluctuation (seasonal, long-term)
- Groundwater flow direction
- Vadose geology (lithology, permeability, type of cover, layering, etc.)
- Saturated geology (lithology, permeability, layering, etc.)
- Aquifer characteristics (saturated hydraulic conductivity, anisotropy, gradient/direction, number of zones, etc.)
- Vadose zone impacts (PHC type, current maximum concentrations, LNAPL)
- Groundwater (GW) impacts (PHC type, is there LNAPL, number of zones impacted, current maximum concentrations)
- Location of PHC sources
- Date/type of known release(s)
- Delineated? (if yes, describe magnitude/size, on-site versus off-site)
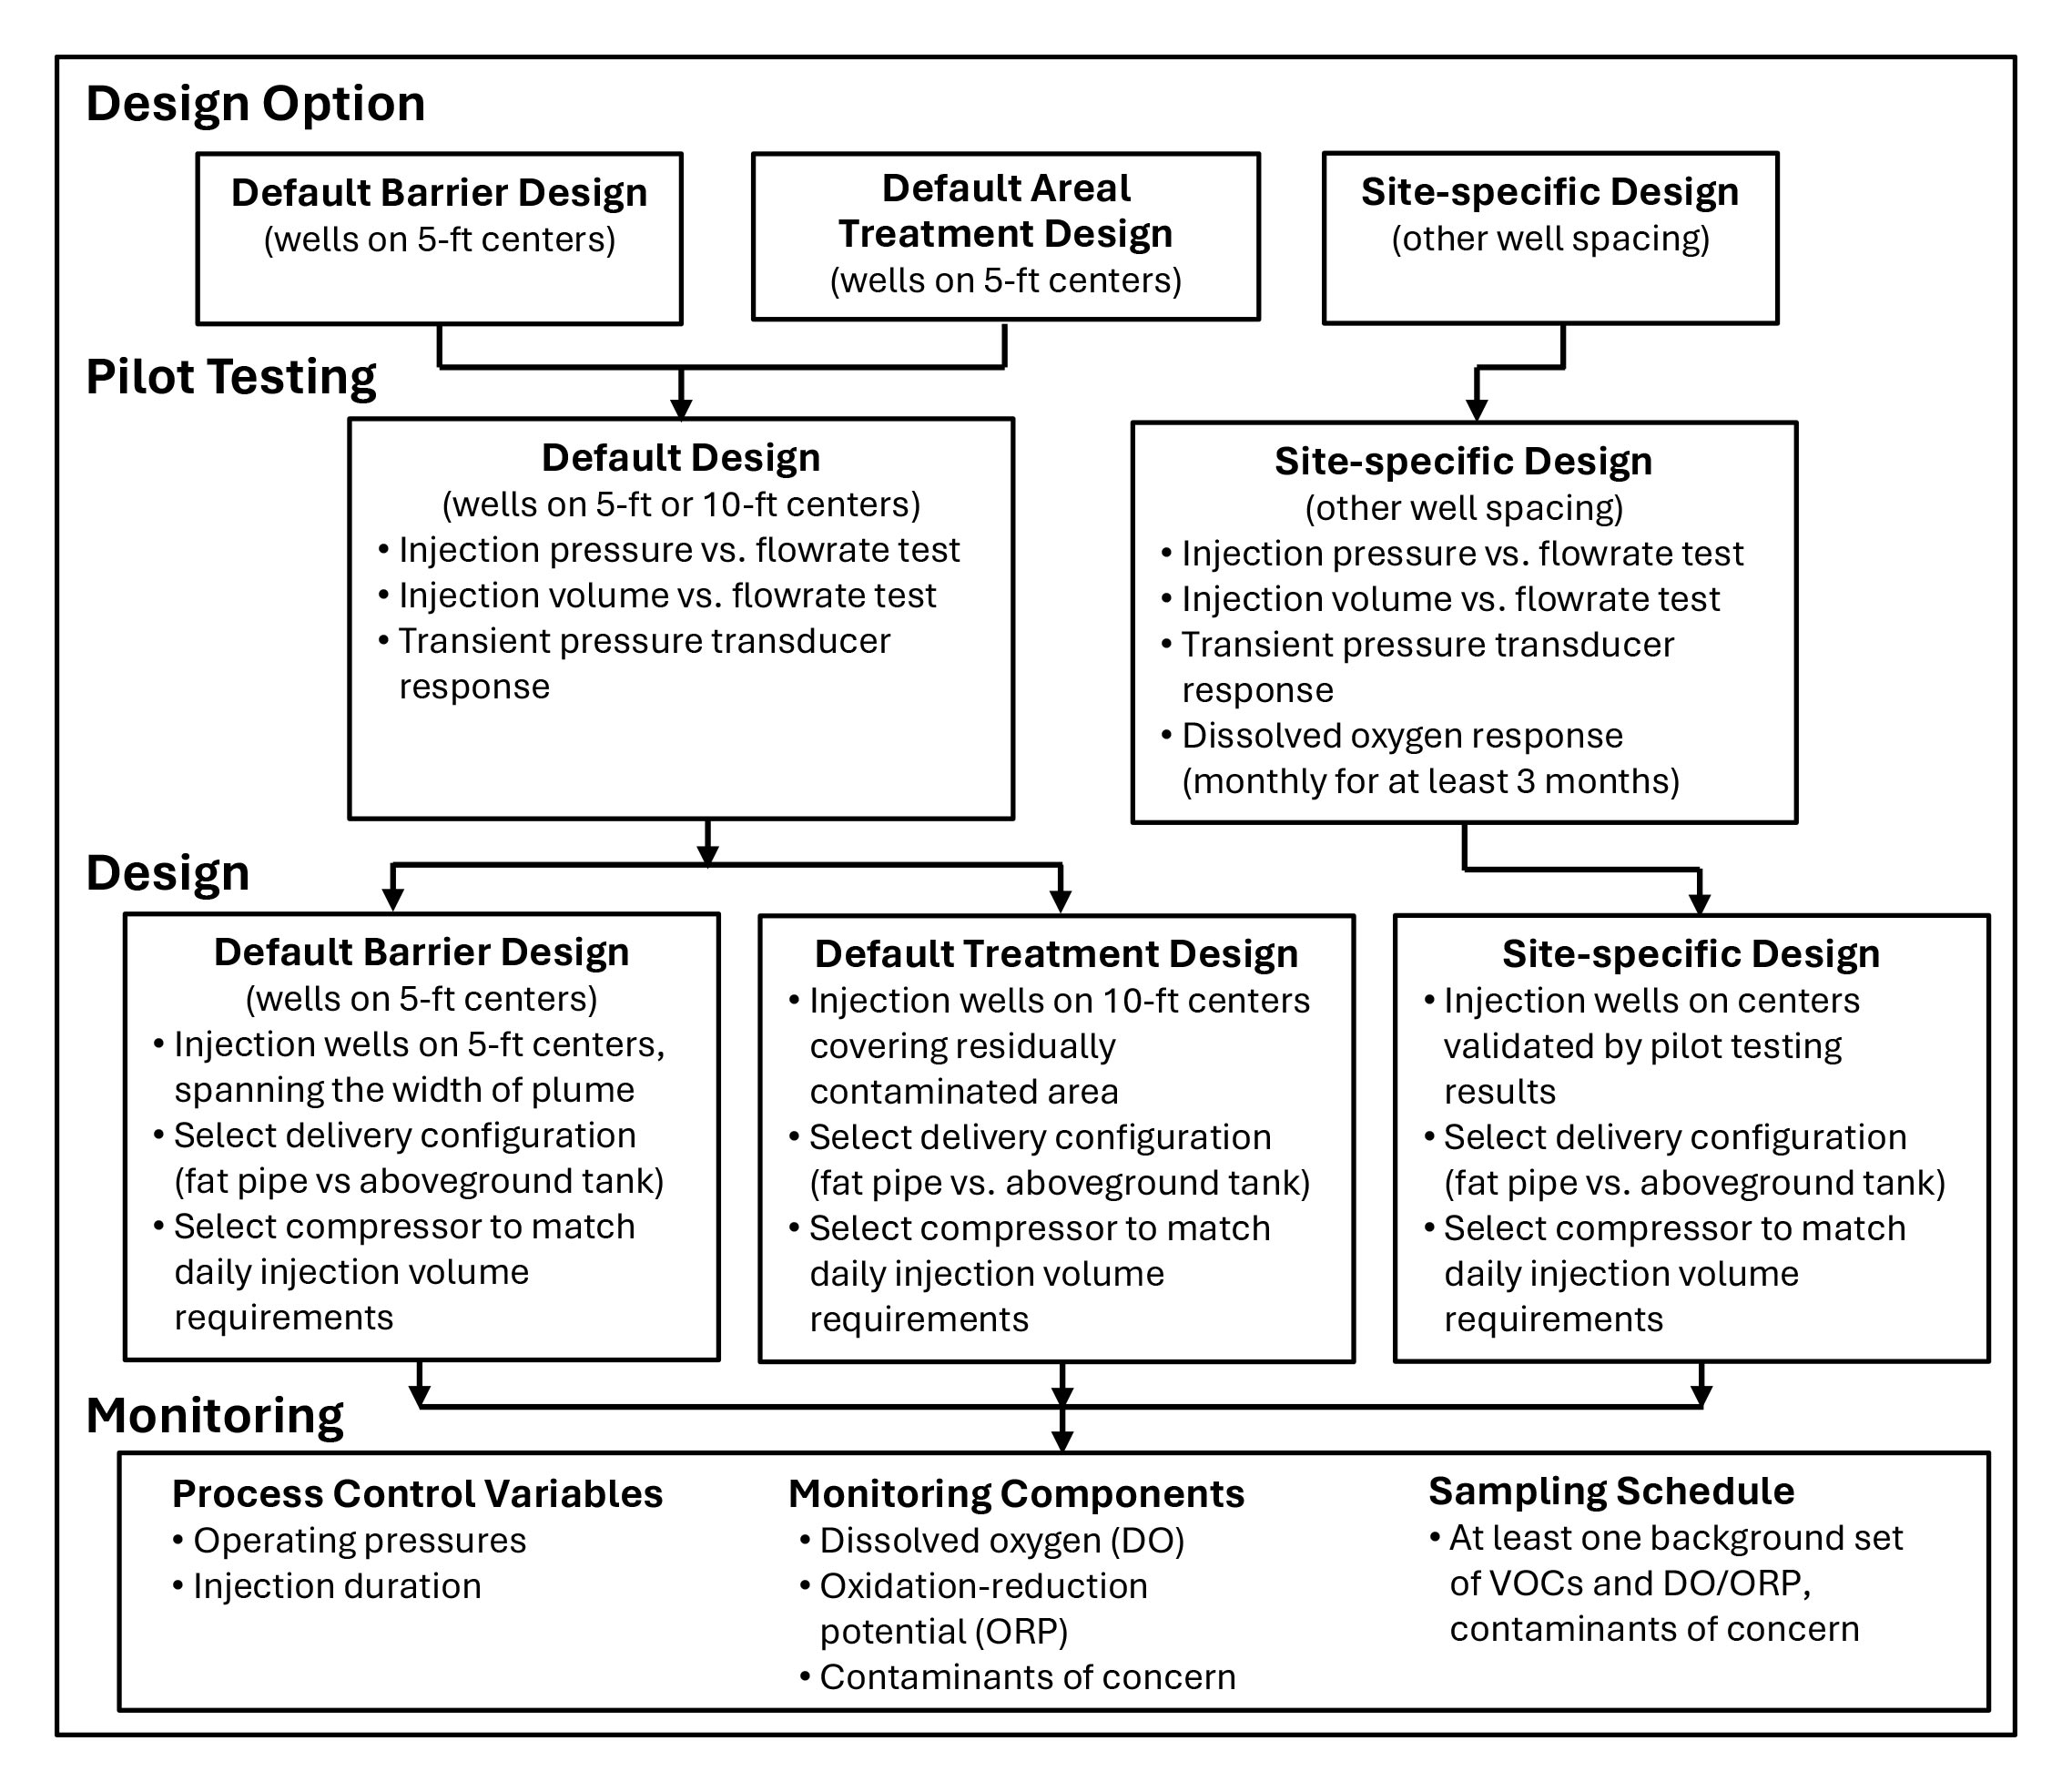
Two types of pilot tests are recommended: 1) Default Design (wells on 5-10 ft centers depending on remediation objective) where monitoring consists of injection pressure vs. flow rate test, injection volume vs. flow rate test and transient pressure transducer response or 2) Site Specific Design (other well spacing) where monitoring consists of default parameters plus dissolved oxygen response (monthly for at least 3 months). OPIS equipment consists of oxygen generators, controllers, Program Logic Controller (PLC), piping, solenoid valves and injection points.
Monitoring includes process control variables (operating pressures, injection duration) and components (e.g., dissolved oxygen, oxidation-reduction potential (ORP) and contaminants of concern).
CRC Care (2018) Technology guide: In-situ air sparging
- Identify indicators of infeasibility (showstoppers);
- Characterise the distribution of air that is likely to occur (i.e., the effectiveness of AS); and
- Identify safety hazards to be addressed in the full-scale design.
Summary
- Evaluate ability to introduce air into the zone of contamination (i.e., is AS feasible?)
- Estimate the air distribution in the target treatment zone (extent and spatial orientation)
- Estimate the distribution (location and concentration) of the contaminants relative to the air distribution
Pilot test objectives typically are not focussed on long-term contaminant reduction trends (because for practical purposes pilot testing is typically conducted over a few days) but can provide useful data on potential maximal increases in initial mass recovery.
Pilot testing in historical guidance has been integrated with empirical approaches for air sparging well spacing and flow rate design. For example, NAVFAC (2001) recommend a well spacing of 30 feet apart (and smaller spacing for shallow sparge wells) with flow rates of 5 to 20 cfm, while ESTCP (2002) recommend a relatively dense default well spacing of 15 ft and flow rate of 20 cfm.
Appendix III - Optimization of Air Sparging Systems
- Pulsed operation of the AS system operation to increase mass recovery through improved air distribution thereby reducing remediation timelines. Additionally, pulsed operation of multiple banks of wells can reduce equipment and operation costs. When AS is intended as a treatment barrier, pulsed operation can reduce the potential for groundwater diversion and flow pass.
- Rebalancing or addition of air flow injection wells to increase flow rates in zones with highest mass removal rates as measured by SVE system or surface efflux monitoring if there is no SVE system present.
- Limiting or reducing the number of air injection wells that are connected to a single flow controller to increase the ability to target select zones and increase uniformity of treatment within the target zone.
- Hydraulic or pneumatic fracturing to enhance remediation by increasing the effective (interconnected) porosity of subsurface materials, which may be particularly effective at sites with low-permeability soil and geologic media.
- Conversion of an air sparging system to a lower energy biosparging system with lower air flow rates, which could reduce operational costs.
- Sparging of pure oxygen to increase dissolved oxygen (DO) concentrations and thus increase biodegradation rates (Shell 2007). Use of pure oxygen can potentially increase DO concentrations up to 40 mg/L in groundwater. Pure oxygen requires specialized equipment, requires that appropriate health and safety measures be followed, and may increase potential for clogging (e.g., when groundwater contains high iron content).
- Use of packers to isolate zones of the air sparging well screen to increase removal efficiency (Drucker 2007).
- Porous sintered polyethylene tips are considered by some practitioners to increase mass transfer efficiency of air to water surrounding the well (US ACE 2013) but there is limited research on their effectiveness. Most applications of air sparging use conventional wells with slotted screens.
Review of Pulsed AS Operation
- Bruce et al. (2001) reported results of field studies where there was about a 30% increase in cumulative removal resulting from pulsed operation versus steady injection conducted at a single well where operation was varied. The AS system at the site was operated in a pulsed mode with a cycle of 3 hr on and 3 hr off, which allowed for pressure to return to near hydrostatic conditions before initiation of the next pulse cycle.
- Johnson et al. (1999) compared mass removal rates of hexane and octane for continuous and pulsed air sparging in laboratory sand tank experiments. The mass recovery under pulsed air flow was up to about 2X the rate observed under continuous air flow. Higher recovery was obtained for octane compared to hexane, which was attributed to the higher solubility of octane.
- Yang et al. (2005) report on a field study at a gasoline contaminated site where an AS system operated in continuous mode for 3 years was converted to pulsed operation. Monitoring of AS parameters in fine sand aquifer indicated optimal pulsing frequency of 4 hrs on and 4 hrs off based on maximizing the DO and hydrocarbon concentrations when the system was on and allowing the groundwater table to recover while the system was off. Pulsed operation increased the average hydrocarbon removal rate (kg/day) by a factor of up to 3X as compared to the previous continuous operation.
- Neriah and Pastor (2017) report results of sand tank experiments where air injection pressures were increased in short bursts (15 sec) over a 10-min cycle (this optimization was referred to as boxcar). Comparing the boxcar to conventional continuous air-injection shows up to a three-fold increase in the single well radius of influence, dependent on the intensity of the short-duration pressure-pulses. The cleanup efficiency of toluene from the water was 95% higher than that achieved under continuous injection with the same average conditions.
Recommended criteria for pulsing frequency is based on visual observation of aquifer relaxation following the start and end of air injection, where pulse times can be determined based on time required for hydraulic gradients (local groundwater mounding) to dissipate after the onset or termination of an interval of air sparging. Evaluation of pulsing frequency can be assessed as part of pilot testing. As new air channels are formed during each pulse, a system that is initially continually operated, will still see benefit when switched to pulsed operation.
Since the seminal work on AS in late 1990’s and early 2000’s, there has been limited study of optimization of AS through pulsed operation. US ACE (2013) provides important information on technology factors for pulsing including design features to optimize operation of equipment and avoiding well siltation through use of check valves.
Neriah and Paster (2018) evaluated how air sparging could be optimized through pulsation frequency by conducting laboratory studies. Small differences in pulse duration (5 minutes) had a modest effect on mass removal rate (12%). Neriah and Paster (2018) also showed how numerical modeling could potentially be used to optimize pulsing duration and that modeling resulted in different criteria compared to the pulse duration based on measurements of groundwater pressure response (GPR) to air injection.
Other Optimizations
Complementary Technologies to Air Sparging
Ozone gas sparging may be considered as an in situ chemical oxidation (ISCO) technology (ITRC 2005), although it also promotes physical removal through stripping near the injection point and biodegradation through conversion to oxygen. A detailed review of use of ozone is provided in Clayton (2011). A briefer summary of advantages and disadvantages is provided in US ACE (2013). Ozone is a strong oxidant but is highly unstable (and consequently must be generated on-site) and has a short half-life. It requires special precautions for use. While there are potential advantages with use of ozone, it’s use for treatment of petroleum hydrocarbon is less common, possibly because of disadvantages identified here.
Injection of water that is super-saturated with carbon dioxide is a technology with potential novel features that could increase efficiency of treatment. When injected, carbon dioxide will come out of solution and result in a high density of bubbles or a multi-phase water and air mixture that potentially could increase the zone of influence relative to conventional air sparging and increase efficiency of gas stripping of contaminants (Nelson et al. 2009; Zhao and Ioannidis 2011; Enouy et al. 2011).