Applied NAPL Science Review
Demystifying NAPL Science for the Remediation Manager
Editor: J. Michael Hawthorne, PG
Asst. Editor: Dr. Rangaramanujam Muthu
ANSR Scientific Review Board
J. Michael Hawthorne, PG, Board of Chairman, GEI Consultants Inc.
Mark Adamski, PG, BP Americas
Stephen S. Boynton, PE, LSP, Subsurface Env. Solutions, LLC
Dr. Randall Charbeneau, University of Texas
Paul Cho, PG, California Regional Water Quality Control Board-LA
Dr. Sanjay Garg, Shell Global Solutions (US) Inc.
Dr. Terrence Johnson, USEPA
Andrew J. Kirkman, PE, BP Americas
Mark Lyverse, PG, Chevron Energy Technology Company
Mark W. Malander, ExxonMobil Environmental Services
Editors Note: We are very pleased to welcome Dr. Dennis Helsel as a regular contributing author of a recurring environmental statistics column in ANSR. Dr. Helsel (PhD, Environmental Science and Engineering, Virginia Tech) has 33 years of experience applying statistics to practical issues in environmental sciences. After a full career with USGS, he is now the owner and lead scientist for Practical Stats, an environmental statistics training and consulting firm. He is the lead author of three textbooks as well as chapters in two handbooks and over 50 journal articles. We hope you enjoy this new feature, and welcome any feedback.
Applied NAPL Science Review (ANSR) is a scientific ejournal that provides insight into the science behind the characterization and remediation of Non-Aqueous Phase Liquids (NAPLs) using plain English. We welcome feedback, suggestions for future topics, questions, and recommended links to NAPL resources. All submittals should be sent to the editor.
LNAPL Transmissivity from Total Fluids Recovery Data
Part 2: Application and Interpretation of Results
GEI Consultants, Inc. and BP Americas
This article is the second in a two part series introducing the estimation of light non-aqueous phase liquid (LNAPL) transmissivity from total fluids recovery data, which is defined as hydraulic removal of LNAPL and groundwater via pumping (either with single or dual pumping systems). Part 1 addressed the calculation methodology, while this part discusses application of the method and interpretation of the results. A brief introduction to LNAPL transmissivity was provided in the July 2011 issue of Applied NAPL Science Review (ANSR) (Volume 1, Issue 7) titled LNAPL Transmissivity.
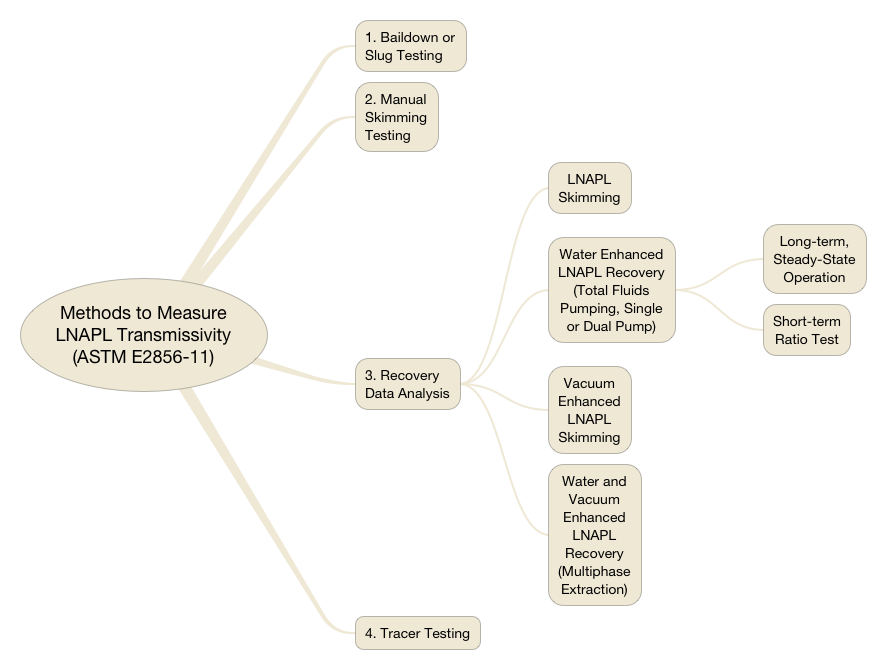
ASTM International, Inc. (ASTM, 2011) published guidance for the calculation of LNAPL transmissivity using four general methods (shown in the following figure).

As noted in the previous article, total fluids recovery removes LNAPL mass, thereby reducing LNAPL saturation over time. This results in reduced LNAPL transmissivity and is observed during water enhanced recovery as a decreasing LNAPL/water production ratio.
Advantages: Calculation of LNAPL transmissivity from total fluids recovery data can be advantageous because it allows for ongoing evaluation of remedial progress via routinely collected system operational data rather than multiple additional baildown or manual skimming tests conducted on single wells. The LNAPL/water ratio method is relatively insensitive to pumping rates because at a given point in time the LNAPL/water ratio is constant for a wide range of groundwater extraction rates.
The LNAPL/water ratio method is appropriate for water enhanced systems that induce drawdowns significantly larger than LNAPL skimming. Systems that pump only LNAPL or low amounts of water with LNAPL are not well represented by this method. Failure to achieve sufficient drawdown may result in erroneously large calculated LNAPL transmissivity values because as the groundwater production rate approaches zero, the ratio method equation results in LNAPL transmissivity values approaching infinity.
This method may also avoid common baildown or manual skimming test errors resulting from groundwater fluctuations that are large relative to baildown test and skimming LNAPL drawdowns. Fluctuations that obscure the smaller drawdowns of skimming and baildown tests do not typically affect total fluids recovery analyses because the overall drawdown induced is typically large relative to the fluctuations. Long-term, non-cyclical groundwater fluctuations (e.g., drought) and heterogeneity may induce some fluctuations in the LNAPL transmissivity estimates, but will typically have minimal effect on the overall trend.
Scale: Total fluids recovery data may be analyzed at different scales in time and space as either:
- A long-term steady-state analysis or
- A short-term LNAPL transmissivity testing method.
For long-term total fluids recovery operations this flexibility may be implemented by measuring production rates and fluid elevations
- More frequently for precise LNAPL transmissivity calculations or
- Less frequently to average out cyclical fluctuations (e.g., tidal or seasonal fluctuations).
Total fluids recovery may also be implemented as short-term individual well tests as an alternative to baildown or manual skimming testing. Calculation of LNAPL transmissivities via short-term pumping of total fluids is a relatively new application often called an oil/water ratio test.
This flexibility of scale is a powerful feature of the method. However, any scale (time or space) grouping must make hydrogeologic sense:
- Wells added together should be adjacent in the same plume,
- All wells must have similar extraction methods (total fluids recovery),
- Time intervals should be internally continuous and consistent in length.
In general, short-term ratio tests represent smaller spatial scales and longer-term analysis represents larger spatial scales.
Interpretation: Total fluids recovery analysis may be used to evaluate existing recovery systems. Long-term recovery data (typically multiple years) can aid in evaluating the success of recovery efforts at reducing LNAPL saturation within a plume (progress/lagging metric).
The long-term evaluation of total fluids recovery data may be conducted for individual wells or for an entire system.
- Individual well evaluations may be used
- To efficiently focus well operations to areas of the plume with hydraulically recoverable LNAPL and
- To determine when to stop operation of individual wells.
- System-wide evaluations can be used to monitor progress of remediation for the plume as a whole.
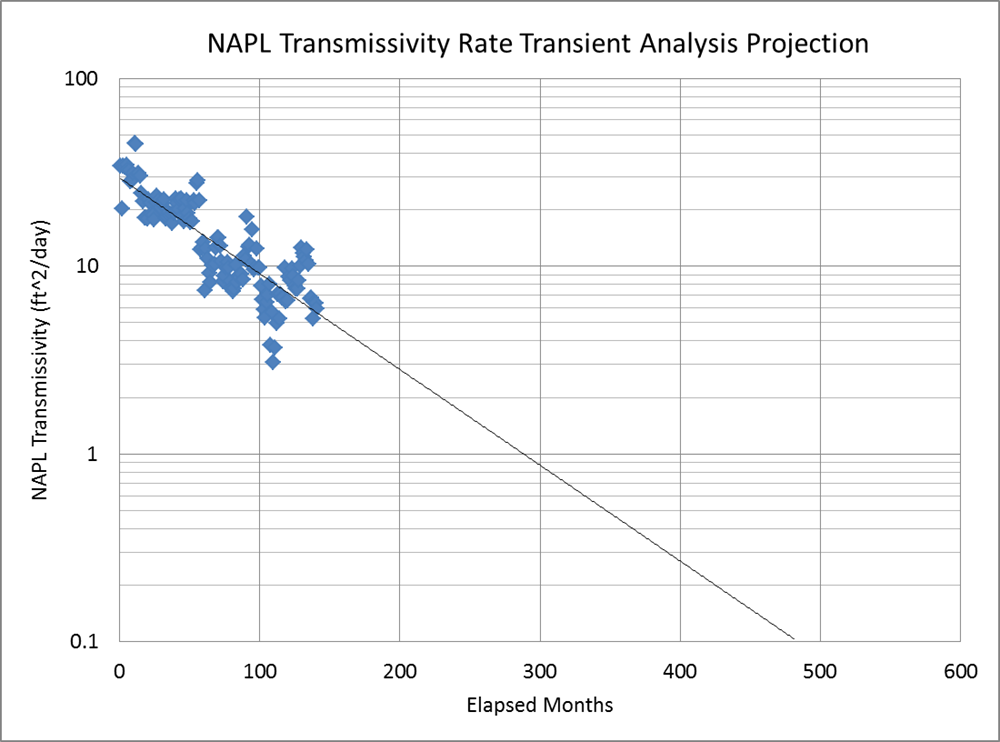
A rate transient decline curve analysis is presented for a refinery with a large scale, multiple well, total fluids recovery system. Seasonal fluctuations are typically small, so fluctuations observed are driven by operational changes in well depths and installation of additional new recovery wells over time.
In order to estimate annual LNAPL transmissivity values for the entire recovery system, the summary annual NAPL/water ratio for the system was multiplied by the average wetted screen length, hydraulic conductivity, and LNAPL/water density ratio. These values were then plotted in standard rate transient decline curve fashion to identify the decline over time and project the time to reach a hydraulic recoverability threshold limit of 0.1 ft2/day.
Other decline curve visualizations and projections that could be performed on this type of data include:
- Linear scale time versus LNAPL transmissivity graphs to observe asymptotic trend behavior and
- Linear cumulative recovery versus LNAPL transmissivity graphs to project expected ultimate recovery.

Decline curve analysis of large scale total fluids recovery system over time versus calculated LNAPL transmissivity from recovery data. The projected line based on the historical decline trend suggests attainment of an LNAPL transmissivity of 0.1 ft2/day after a total elapsed time period of approximately 480 months.
Caution: Although this method appears simple, failure to incorporate the considerations described in this review may result in substantial error, particularly if the LNAPL conceptual site model (LCSM) is not clearly understood. For example, water extraction under perched LNAPL conditions will not have a significant effect on LNAPL recovery when the LNAPL is not in hydraulic communication with the water-table. The powerful flexibility of scale analysis offered by this method may also lead to misapplication. For example, a plume-wide calculation of LNAPL transmissivity may indicate that on average LNAPL transmissivity is below the hydraulic recoverability limits (ITRC, 2009). However, individual wells may still exhibit appreciable LNAPL transmissivity values. Determining if those wells should continue operation is a site-specific analysis that should be based on risk and other required regulatory factors. As always, the values obtained from these calculations must be evaluated in terms of their scale in time and space and their meaning to overall remediation progress for a site. Application of this approach is recommended in conjunction with a comprehensive understanding of the LCSM and the strengths and limitations of the calculations performed.
For Further Reading:
ASTM (2011) The Standard Guide for Estimation of LNAPL Transmissivity. Designation: E2856-11, ASTM International. 66 pp.
Charbeneau, Randall J. (2007) LNAPL Distribution and Recovery Model (LDRM), Volume 1: Distribution and Recovery of Petroleum Hydrocarbon Liquids in Porous Media. API Publication 4760, January 2007, American Petroleum Institute Regulatory and Scientific Affairs Department, 53 pp.
ITRC (2009), LNAPL Remediation Technologies, ITRC Publication LNAPL-2, Interstate Technology & Regulatory Council.
Sale, Tom (2001), Methods for Determining Inputs to Environmental Petroleum Hydrocarbon Mobility and Recovery Models, API Publication 4711, American Petroleum Institute.
Sale, Tom and Applegate, David (1997), Mobile NAPL Recovery: Conceptual, Field and Mathematical Considerations. Ground Water V. 35, No. 3, 418-426 pp.
Practical Stats
Dr. Dennis Helsel
www.practicalstats.com
In the first few newsletters I’ll work through an analysis of LNAPL transmissivities from recovery data measured at 34 wells in a refinery. To start, what class of tests should I use, parametric or nonparametric? Parametric tests are what many scientists have been taught in their college
statistics course (remember that, or is it too painful?). These tests require data to have a particular shape, usually a normal distribution, so our first step is to test the assumption of normality.
Figure 1 shows a boxplot of the 34 LNAPL transmissivities. Three characteristics indicate these data are non-normal:
1) many ‘outliers’ exist at the upper end;
2) the top part of the box is larger than the bottom;
3) data are smashed down towards zero and may include many zero values.
Figure 1
These are characteristics of skewed (non-normal) data. When parametric tests are used with skewed data their p-values will be too insignificant, far too often missing the correlations or trends being tested (a p-value is just a statistics metric to decide if there is a meaningful signal in the data).
Scientists have tried three ways to deal with skewness.
Figure 2
I’ll use the nonparametric methods approach in the coming newsletters. In the next issue I’ll look at statistical trend analysis of LNAPL transmissivity over time.
Related Links
API LNAPL Resources
ASTM LCSM Guide
Env Canada Oil Properties DB
EPA NAPL Guidance
ITRC LNAPL Resources
ITRC LNAPL Training
ITRC DNAPL Documents
RTDF NAPL Training
RTDF NAPL Publications
USGS LNAPL Facts
ANSR Archives
Coming Up
Look for more articles on LNAPL transmissivity as well as additional explanations of laser induced fluorescence, natural source zone depletion and LNAPL Distribution and Recovery Modeling in coming newsletters.
Announcements
An updated version of the ASTM Guide for Calculating LNAPL Transmissivity is Now Available for Purchase at www.astm.org.
ASTM Standard E2856 – Standard guide for Estimation of LNAPL Transmissivity is now available
The ASTM LNAPL Conceptual Site Model (LCSM) workgroup is actively updating the ASTM LCSM guidance document. If you are interested in participating on this team or would like to send comments for consideration – please contact Andrew Kirkman of BP Americas (team leader).
ANSR now has a companion group on LinkedIn that is open to all and is intended to provide a forum for the exchange of questions and information about NAPL science. You are all invited to join by clicking here OR search for “ANSR – Applied NAPL Science Review” on LinkedIn. If you have a question or want to share information on applied NAPL science, then the ANSR LinkedIn group is an excellent forum to reach out to others internationally.


