J. Michael Hawthorne, PG, Board Chairman, GEI Consultants, Inc.
Andrew J. Kirkman, PE, BP Corporation North America
Robert Frank, RG, Jacobs
Paul Cho, PG, CA Regional Water Quality Control Board-LA
Randy St. Germain, Dakota Technologies, Inc.
Dr. Terrence Johnson, USEPA
Brent Stafford, Shell Oil Co.
Douglas Blue, Ph.D., Imperial Oil Environmental & Property Solutions (Retired)
Natasha Sihota, Ph.D., Chevron
Kyle Waldron, Marathon Petroleum
Danny D. Reible, Professor at Texas Tech University
Reeti Doshi, National Grid
Mahsa, Shayan, Ph.D., PE, AECOM Technical Services
Frequently Asked Questions
DISCLAIMER: This article was prepared by the author(s) in their personal capacity. The opinions expressed in this article are the author’s own and do not necessarily reflect the views of Applied NAPL Science Review (ANSR) or of the ANSR Review Board members.
Anchor QEA, LLC
Introduction
Non-aqueous phase liquid (NAPL) dissolution can create persistent plumes of dissolved NAPL components in groundwater. Dissolution of multicomponent NAPLs is complex, and numerical models that explicitly simulate it at a site scale are not widely available. This study introduces an equilibrium partitioning method to simulate, as a first approximation, the time required to dissolve the most soluble chemical components from a multicomponent NAPL that contains a significant fraction of relatively insoluble mass. The effective distribution coefficient that describes depletion of a specific soluble compound from NAPL is calculated based on the NAPL and soil properties.
Dissolution of the Most Soluble Components from NAPL
Achieving groundwater cleanup goals at NAPL sites may take decades depending on the remedial approach and the rate that the chemical components dissolve from the NAPL into groundwater. Some regulatory jurisdictions require predicting and comparing the time to achieve groundwater cleanup for various remedial options as part of feasibility studies. It would be difficult to predict the time required to achieve regulatory standards for all chemical components identified in multicomponent NAPL. However, by focusing on select compounds that have relatively high effective solubility and strict regulatory standards, groundwater cleanup times can be estimated as a first approximation and compared across multiple remedial options. Cleanup of all NAPL components may take longer. At petroleum and manufactured gas plant sites, for example, naphthalene and benzene are commonly of particular interest as they tend to drive risk related to groundwater exposure pathways. Depending on the NAPL type and degree of weathering, these compounds may represent a relatively small fraction of the total NAPL mass, but they can contribute a large fraction of the NAPL component mass in groundwater. Using Raoult’s Law, the effective solubility and gradual depletion of select compounds from NAPL over time can be estimated, but that approach is complicated because multicomponent NAPLs often have significant unresolved chemical mass with unknown composition, molecular weight distribution, and solubility.
To help estimate the time required for a NAPL zone to achieve groundwater cleanup goals for select, soluble compounds, a numerical modeling method was developed and demonstrated by comparison versus an empirical NAPL dissolution dataset.
Methods
Empirical Sand Tank Model
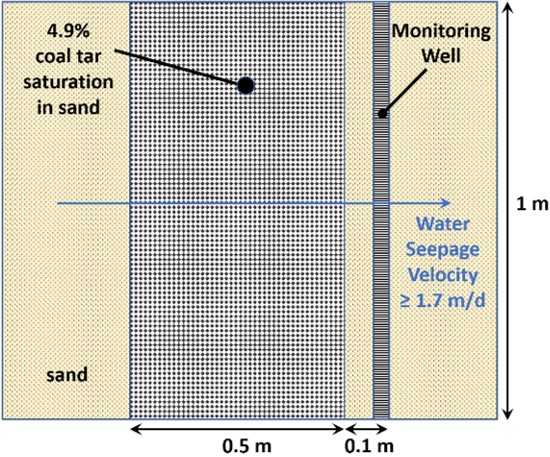
Eberhardt and Grathwohl (2002) studied dissolution of residual-phase coal tar in a laboratory sand tank model with flowing water. Relevant elements of their experimental setup are illustrated in Figure 1. The NAPL zone was 0.5 meter (m) wide parallel to flow, with 4.9% NAPL saturation. The water seepage velocity was 1.7 meters per day (m/d) initially but was later increased.
Equating Eberhardt and Grathwohl’s retardation equation to the standard retardation equation for equilibrium partitioning to organic carbon leads to the following equation for an effective distribution coefficient that approximates mass transfer—to the aqueous phase from multicomponent NAPL containing a significant relatively insoluble fraction—for a specific soluble chemical (compound i) (Gefell and Gurung 2022; in press):
The effective Kd method was demonstrated using a one-dimensional numerical solute transport model (MT3D; Zheng 1990) with 100 cells representing a flowline through the center of the NAPL zone in Eberhardt and Grathwohl’s sand tank model. Each MT3D cell was a 1 cm cube. Simulations were performed for the most soluble PAH (naphthalene) and VOC (indene). Indene was selected rather than benzene because indene had a higher effective solubility, and the indene data were easier to extract from the published data graphs. Of the chemical components in the coal tar sample, naphthalene and indene represented only 15% of the total initial coal tar mass, but 76% of the total aqueous mass of all identified NAPL components in equilibrium with water. Most of the 30 identified NAPL components had initial effective solubilities orders of magnitude lower than those for naphthalene and indene.
For each modeled compound, the initial aqueous concentration in the simulated NAPL zone (in the center of the numerical model grid) was set at the reported effective solubility value (Eberhardt and Grathwohl 2002). To represent the initial mass of each compound sorbed in the NAPL, Kd values were calculated using Equation 1 based on data presented by Eberhardt and Grathwohl 2002. Longitudinal dispersivity (α) was initially set equal to 5 cm, which is one-tenth of the NAPL zone width parallel to flow. The model was first run using the Kd values calculated using Equation 1. Then, for comparison, Kd and α were adjusted to optimize the model fit and evaluate the difference between the optimized Kd and the initial Kd estimate.
Results
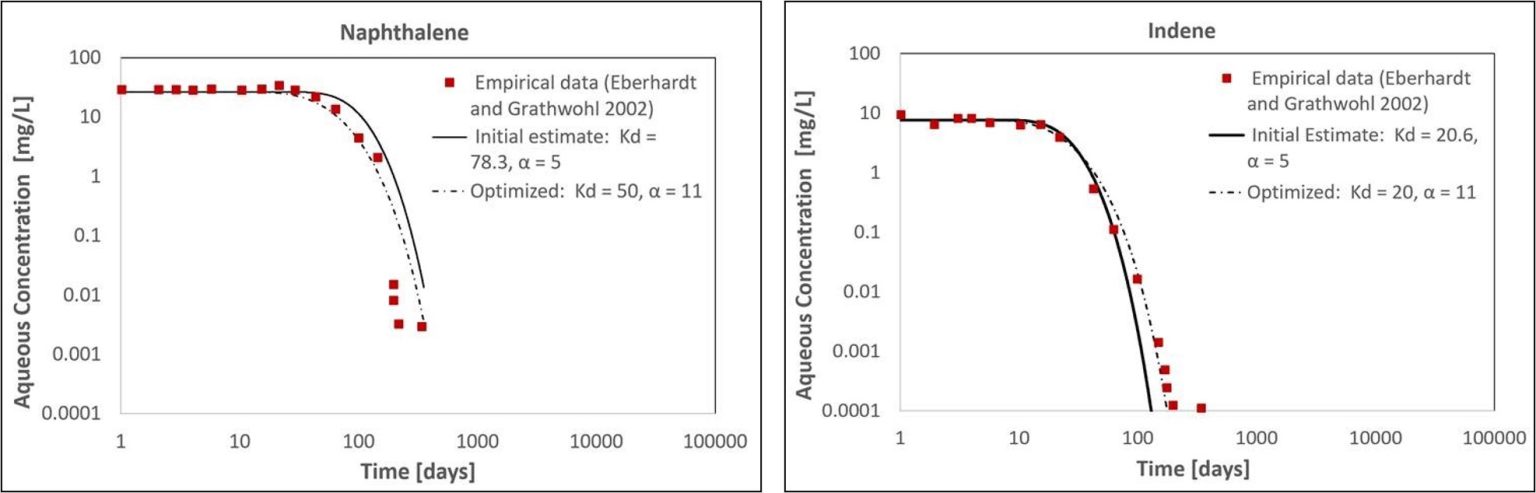
The initial MT3D model with Kd values calculated using Equation 1 produced a reasonable visual match to the empirical aqueous concentrations for naphthalene and indene downgradient of the simulated NAPL zone (Figure 2). Similar to the empirical dataset, the model predicted a delay in the arrival of the dissolution front and subsequent concentration decline over multiple orders of magnitude (Figure 2). Relative to the initial Kd estimates calculated using Equation 1, the optimized Kd values fit to the empirical data were within a factor of 1.6 for naphthalene and 1.03 for indene.
For each compound, the initial and optimized Kd values produced similar concentration declines after the arrival of the dissolution front (Figure 2). The total time required for the naphthalene concentration to decline by three orders of magnitude was 330 days using the initial Kd estimate and 282 days with the optimized model (relative percent difference of 16%; Figure 2a). For indene, the same decrease took 88 days using the initial Kd estimate and 114 days with the optimized model (relative percent difference of 26%; Figure 2b). These differences could relate to: 1) the margin of error in the sand tank model parameters reported by Eberhardt and Grathwohl (2002); 2) non-uniform distribution or composition of NAPL in the NAPL zone; and/or 3) deviation from the assumption that the NAPL undergoes little or no change other than the dissolution of the most soluble compounds. However, considering the complexity of multicomponent NAPL dissolution and the uncertainty in measuring the Equation 1 input parameters at actual field sites, these differences are small and would not preclude using this method to estimate long-term dissolution of select, soluble compounds from multicomponent NAPL zones. Numerical modeling provides flexibility to account for factors that may affect long-term NAPL dissolution in field settings, including heterogeneous porous media, differences in NAPL properties (composition, saturation, etc.), hydraulic gradient changes (tides, pump and treat, etc.), and degradation in the aqueous phase.
Parameter Estimation and Application at Field Sites
In the preceding sections, the Kd method was validated by comparing model results to empirical data produced in a controlled laboratory study. To apply the method at an actual field site, the Equation 1 input parameters would need to be measured or estimated, preferably on a site-specific basis. Parameter measurement methods can be summarized as follows.
- ρ0 – lab measurement of NAPL density at temperature equivalent to subsurface condition
- fi,o – lab analysis of NAPL chemistry (typically VOCs and PAHs or semivolatile organic compounds [SVOCs])
- n, S0, ρb – these parameters are reported from Dean-Stark extraction analysis of soil or sediment sample(s) containing NAPL
- nc – calculate as follows: nc = n (1- S0)
- Ci,sat – three typical options:
- sample groundwater at monitoring well containing accumulated NAPL, or porewater in sediment containing NAPL – collect water sample as close as practicable to the NAPL-water interface and filter the sample through a porous ceramic cup to prevent including NAPL in the analyzed groundwater sample – analyze for VOCs and PAHs or SVOCs
- equilibrate water with NAPL in a laboratory vessel, then analyze water for dissolved chemicals (again, avoid including NAPL in analyzed water sample)
- estimate using Raoult’s law based on NAPL composition
If not measured on a site-specific basis these parameters can be estimated, but with lower resulting model accuracy. In any case, model sensitivity analyses should be performed.
In applying the Kd method for a field site, the user should develop a conceptual model of the NAPL zone in the direction parallel to groundwater flow, including the overall groundwater flow system near the NAPL zone and the general distribution, saturations, and composition of NAPL in soil or sediment. The numerical model should be constructed to match the conceptual model using parameter values measured at the site, to the extent possible. The Kd values in the modeled NAPL zone should be calculated using Equation 1. Where appropriate, Kd values can be discretized and may vary spatially based on available site data regarding NAPL saturation, NAPL composition, and/or effective solubility of the modeled NAPL components. In the remainder of the model, Kd values can be set equal to zero for simplicity, or a value calculated based on the organic carbon content of the uncontaminated porous medium. For each compound of interest, the initial aqueous concentration in the simulated NAPL zone should be set to the effective solubility. The porosity should be set equal to nc in the NAPL zone, and equal to n in the remainder of the model.
Numerical modeling provides the flexibility to include compound-specific degradation in the aqueous phase, transient hydraulic heads, stratigraphic heterogeneity, and changes that may occur during remediation (changes in hydraulic gradient or degradation rate, and/or removal of part of the NAPL zone). In addition, the influence of NAPL presence on the hydraulic conductivity of water (i.e., relative permeability) in the NAPL zone can be included.
Although the simulation results presented herein used MT3D, other models can implement this method, including: MODFLOW 6, MODFLOW-SURFACT, PHT3D, and PFLOTRAN. For applications with vertical flow in sediment, CapSim can be used (Shen et al. 2018).
Conclusion
A Word of Caution
References
Gefell, M.J., and D. Gurung, 2022. “Predicting Multicomponent NAPL Dissolution Using an Equilibrium Partitioning Model, With Demonstration Using Empirical Data.” 2022 Northwest Remediation Conference (Tacoma, Washington); October 6, 2022. Available at: https://nwremediation.com/wp-content/uploads/2B_Gefell.pdf.
Gefell, M.J., and D. Gurung, in press. “Modeling Dissolution of Soluble Compounds from Multi-Component NAPL Using a Desorption Approximation.” Accepted for publication in Groundwater.
Shen, X., D. Lampert, S. Ogle, S., and D. Reible, 2018. “A software tool for simulating contaminant transport and remedial effectiveness in sediment environments.” Environmental Modelling & Software 109: 104-113.
Zheng, C., 1990. MT3D: A Modular Three-Dimensional Transport Model for Simulation of Advection, Dispersion, and Chemical Reaction of Contaminants in Groundwater Systems. S.S. Papadopulos & Associates, Inc. Rockville, Maryland. October 17, 1990.
Research Corner

2019 (copyright 2019 all rights reserved)
Colorado School of Mines
Abstract
Related Links
ANSR Archives
Coming Up
Announcements
Upcoming ITRC Training
- April 13: ITRC PFAS Introductory Training
- May 11: Sustainable Resilient Remediation (SRR)
Upcoming IPEC Training
- April 13: Organo-Halide Destruction via Biostimulation Without Augmentation… and Another WOTUS Rule Change?
- April 20: Molecular Biological Tools to Optimize Hydrocarbon Biodegradation and Corrosion Inhibiting Method for Remediating Hydrocarbon Releases at Pipeline, Tank Batteries & AST Sites
- May 4: Hydrocarbon Pipeline Integrity and Changes to Hydrocarbon Components During Composting Study
- May 18: Enhance VOC, Sorbed, Globule, NAPL Remediation Exposing Limiting Factors